
Interactive Demonstration of Function Inequalities and Logic
Loading the math board and drawing, please wait…
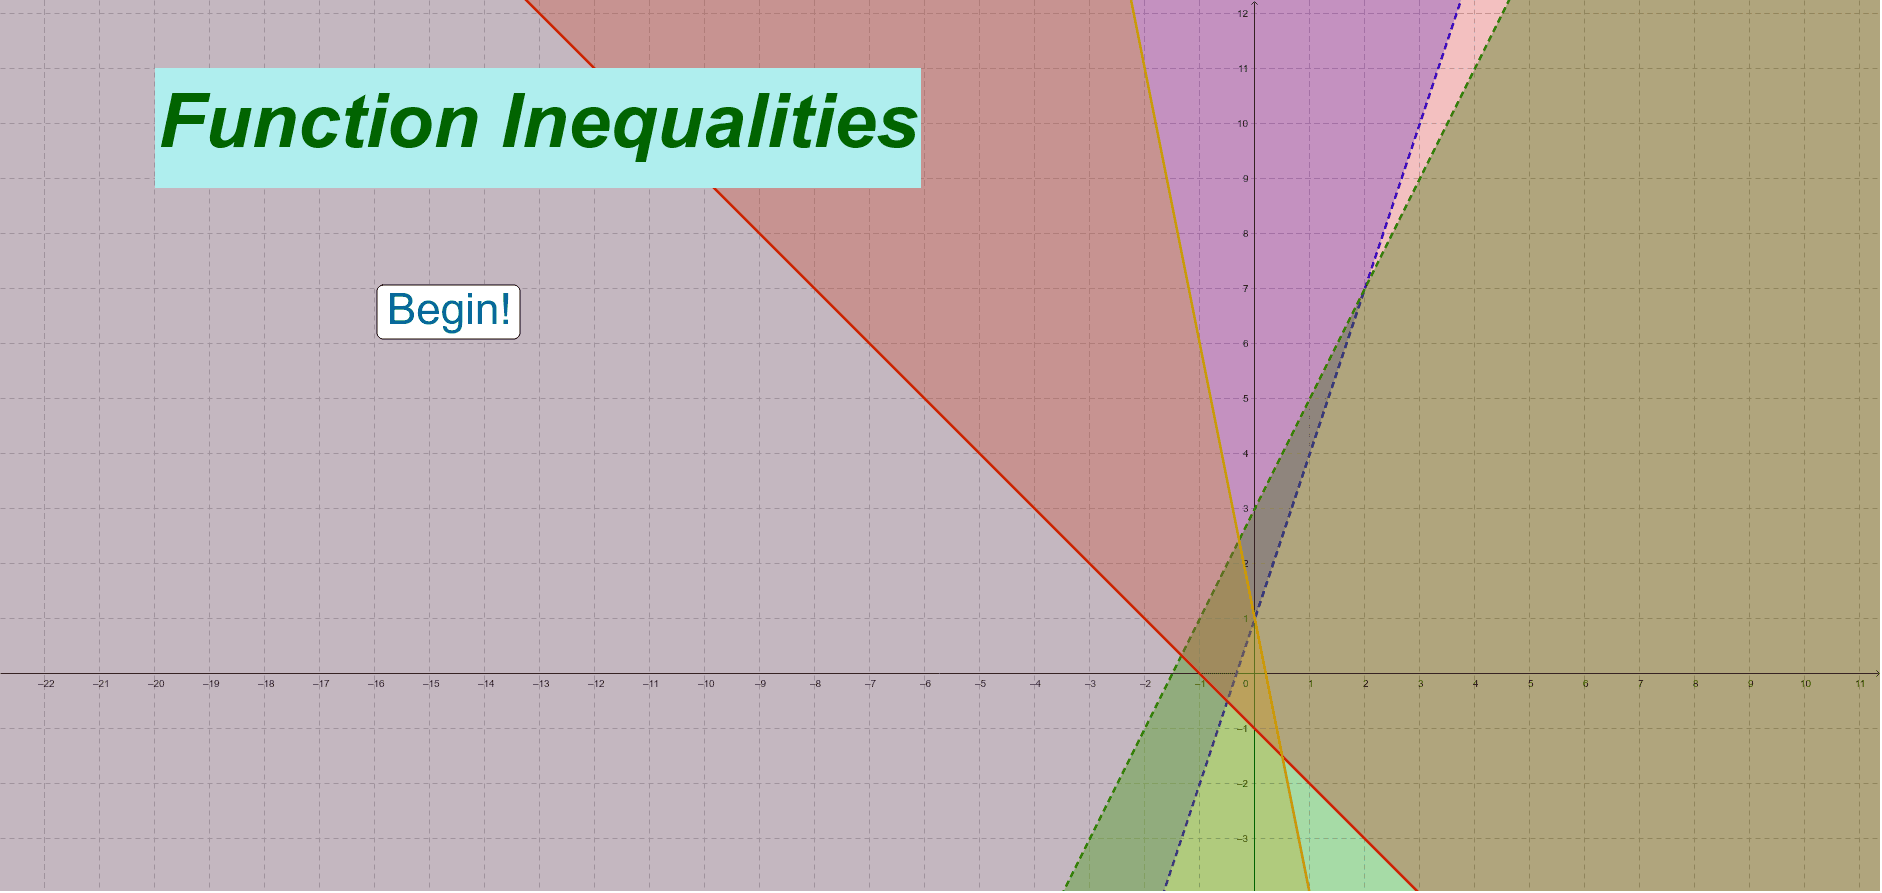
① This GeoGebra example demonstrates function inequalities (e.g., comparing f(x) and g(x)) through graphical visualization and step-by-step logical reasoning using interactive buttons and text objects. ② Core mathematical concepts include function graphs, solution sets of inequalities, logical branching, and properties of basic functions like cosine. ③ Construction highlights: from the summary, commands Point and Ray are used to create points and rays; multiple function objects (f, g, h, i, j, etc.) and buttons (button1 to button6) are defined, with text objects (text1 to text7) displaying reasoning steps, forming an interactive exploration environment. ④ Suitable for middle/high school mathematics (e.g., functions and inequalities in Grade 10-11) and logic training, helping students intuitively connect inequality solutions with graphical representations.
GeoGebra Commands & Parameters
Point(yAxis) → APoint(yAxis) → BRay(A, B) → gPoint(yAxis) → CPoint(yAxis) → DRay(C, D) → iPoint(p) → E
AI Drawing Prompt Reference
Draw a coordinate plane with a vertical y-axis. Place two distinct points on the y-axis and construct a ray starting from one point through the other, extending upward. Then place two more points on the y-axis and construct a second ray in a different direction. Finally, select a point on a given curve that represents a function graph. The overall scene includes several function curves and interactive buttons that guide step-by-step logical reasoning about comparing function inequalities, with text labels showing each reasoning step.
The prompt above was compiled from the original drawing commands and is for reference only.