
Integral and Expected Value Calculation
Loading the math board and drawing, please wait…
In collections
Solution of Systems of nonlinear Equations
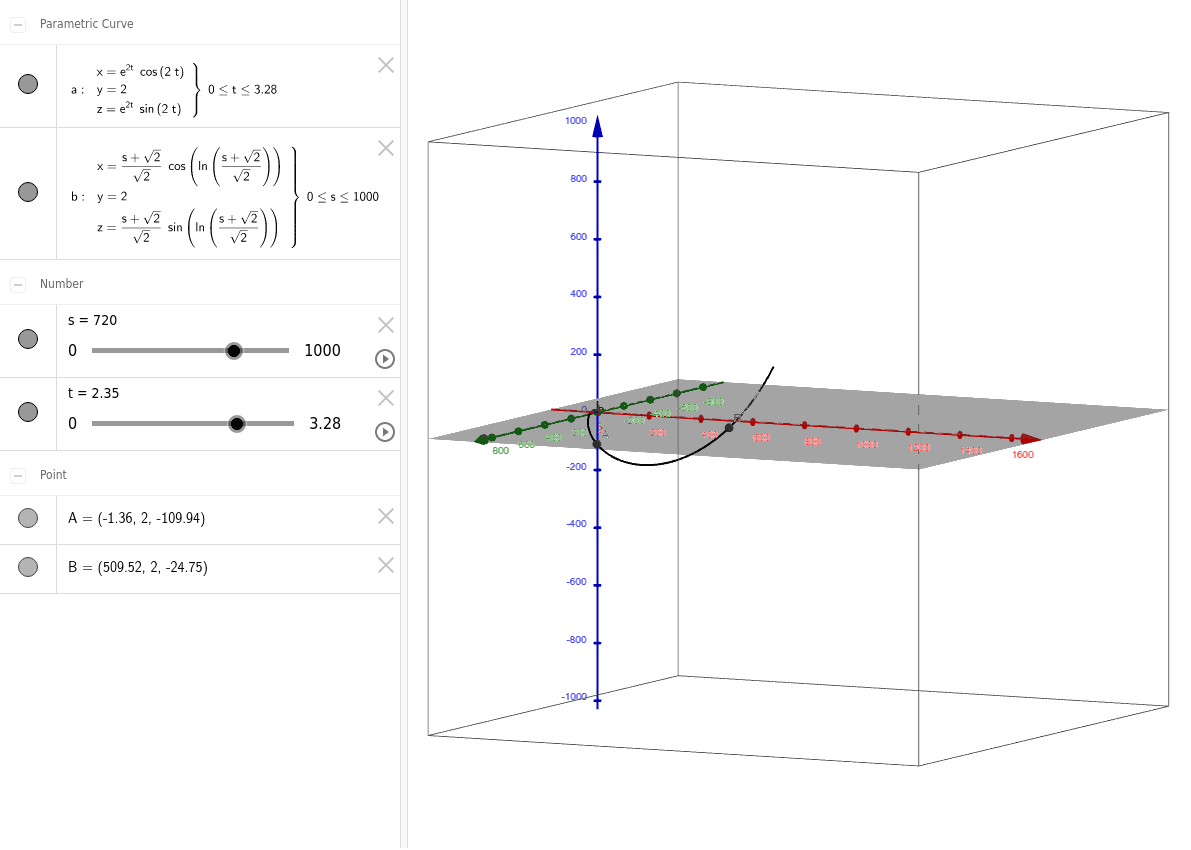
This example demonstrates how to use GeoGebra to plot integral curves and calculate expected values. The core mathematical concepts involved include integral calculus, normal distribution, and random experiments. The construction highlights the use of the CurveCartesian command to draw curves, along with parameters t, A, b, a, s, B. Suitable for high school and above students to learn and understand the applications of calculus and probability & statistics.
GeoGebra Commands & Parameters
CurveCartesian(((s + sqrt(2)) / sqrt(2) * cos(log((s + sqrt(2)) / sqrt(2)))), 2, ((s + sqrt(2)) / sqrt(2) * sin(log((s + sqrt(2)) / sqrt(2)))), s, 0, 1000) → bCurveCartesian((ℯ^((2 * t)) * cos((2 * t))), 2, (ℯ^((2 * t)) * sin((2 * t))), t, 0, 3.28) → a
AI Drawing Prompt Reference
Plot two integral curves: one involving a logarithmic and cosine function composite with parameter s ranging from 0 to 1000, and another involving an exponential and cosine function composite with parameter t ranging from 0 to 3.28. Highlight the geometric shapes and trends of these curves to demonstrate the application of integral calculus and probability statistics.
The prompt above was compiled from the original drawing commands and is for reference only.