
Infinite Limits Demo
Loading the math board and drawing, please wait…
In collections
Calculus 1 Graphical Illustrations
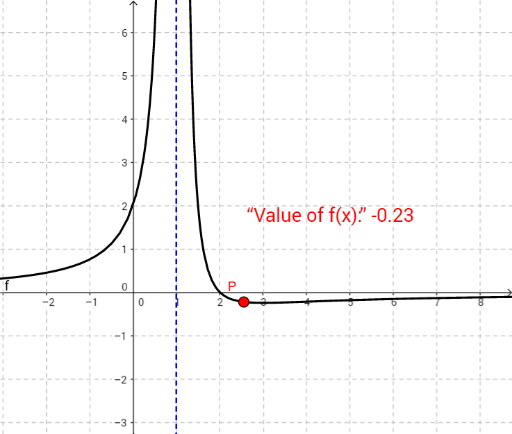
This example demonstrates the behavior of functions at infinity and the concept of infinite limits. It involves core math concepts like infinite limits, function graphs, and slope changes. Constructed using GeoGebra commands Point for objects f, a, P, b, and text1 for displaying text. Suitable for high school calculus education to understand the relationship between limits and function graphs.
GeoGebra Commands & Parameters
Point(f) → P
AI Drawing Prompt Reference
Draw the graph of a function f and observe the behavior of function values as x approaches infinity. Mark a point P on the graph to indicate the behavior of function f at infinity.
The prompt above was compiled from the original drawing commands and is for reference only.