
Infinite Decimal Expansions
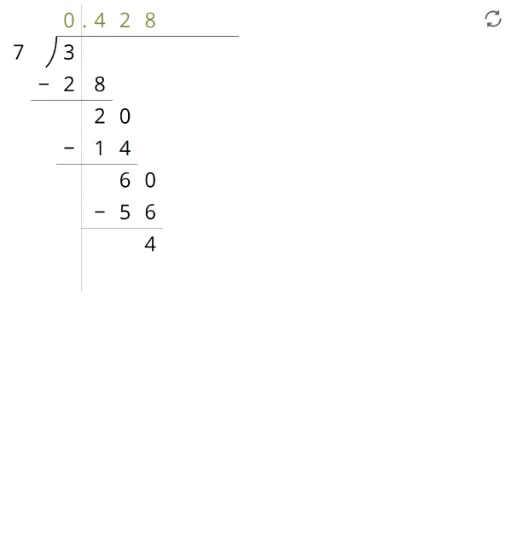
Loading the math board and drawing, please wait…
This example demonstrates the geometric representation of infinite decimal expansions, involving concepts such as infinite decimals, function graphs, and limits. The construction uses GeoGebra commands A, B, and pic1. Suitable for middle or high school mathematics to understand the properties of infinite decimals and function graph plotting.
GeoGebra Commands & Parameters
Point A(-9.839416531322428, -2.6880373990752506)Point B(0.021283913908670193, -2.6880373990752506)
AI Drawing Prompt Reference
Draw a graph showing infinite decimal expansions. Include two points: one at (-9.839416531322428, -2.6880373990752506) and another at (0.021283913908670193, -2.6880373990752506). These points should be on the same horizontal line with the same y-coordinate. The graph should illustrate the concept of infinite decimals, showing the distance and positional relationship between the points. Construction order: first draw the two points, then connect them, and label the coordinates.
The prompt above was compiled from the original drawing commands and is for reference only.