
Inequalities Question: An Algebraic-Geometric Exploration
Loading the math board and drawing, please wait…
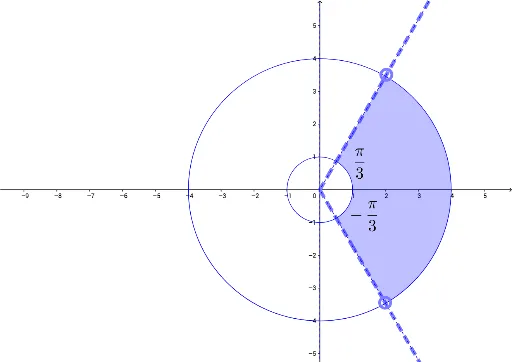
This GeoGebra example dynamically illustrates an inequality problem, combining algebraic expressions with geometric visualization to help learners intuitively grasp solution sets and properties of inequalities. Core mathematical concepts include inequalities, algebra, quadratic functions, the Pythagorean theorem, continuity, and arithmetic mean-geometric mean relationships. The construction uses the Point command to create key points, defines functions f and g, parameters a, b, and e, and employs text objects text1 and text1_1 to display dynamic values or conclusions. Suitable for upper secondary or pre-university students, this resource is ideal for exploring inequality proofs, comparing function graphs, and seeing how algebra and geometry reinforce each other. It can serve as a classroom demonstration or a self-study tool for deepening understanding of inequality structures.
GeoGebra Commands & Parameters
Point(f) → APoint(g) → B
AI Drawing Prompt Reference
Draw a dynamic graph for an inequality problem, including the graphs of two functions f and g, create key points A and B using the Point command, show the graphs of functions f and g and their intersection points, and display the dynamic values of parameters a, b, and e, using text objects to show the solution set of the inequality and related conclusions.
The prompt above was compiled from the original drawing commands and is for reference only.