
Index Division Demonstration
Loading the math board and drawing, please wait…
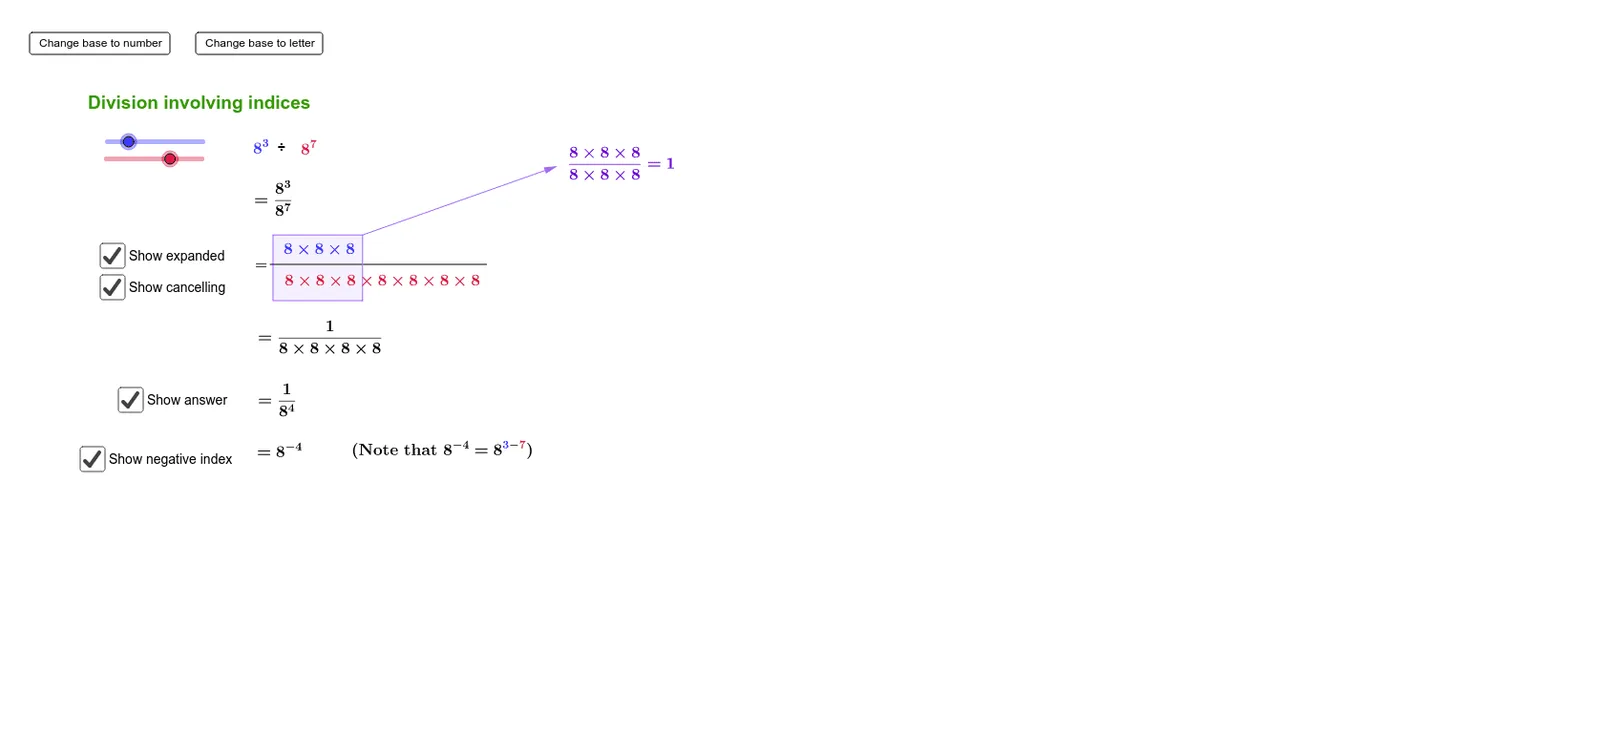
This example demonstrates the rules of index division and its geometric representation. It involves core mathematical concepts such as index operations, quotient rules, and geometric figure construction. GeoGebra commands and objects like RandomElement, If, Segment, Polygon, and Vector are used in the construction. Suitable for middle school students and above to understand the geometric meaning of index operations.
GeoGebra Commands & Parameters
RandomElement(basesNumbers) → baseIf(dm > dn, dm / 1.6, dn / 1.6) → vinculumPositionIf(dm ≤ 10, First[a1Ten, (dm * 2) - 1], a1More) → text17Segment(A, B) → cIf(dm < dn, (dm / 1.7 + 0.25, -5.2), (dn / 1.7 + 0.25, -5.2)) → CPolygon(C, D, E, F) → poly1, c_1, d, e, fVector(C, G) → uIf(dm < dn, text18, text16) → smallestProductIf(dm ≤ dn, "1", First[a1Ten, (abs(dm - dn) * 2) - 1]) → divAnsNumeratorIf(dm ≥ dn, "1", First[a1Ten, (abs(dm - dn) * 2) - 1]) → divAnsDenominatorIf(dm ≟ dn, "1", If[dm > dn, base + "^{" + (dm - dn) + "}", "\frac{1}{" + base + "^{" + (dn - dm) + "}}"]) → ansLine4If(dm ≟ dn, "1", If[dm > dn, base, "\frac{1}{" + base + "}"]) → text21If(dm < dn, base + "^{" + (dm - dn) + "}", "") → finalAns
AI Drawing Prompt Reference
Draw a geometric figure to demonstrate the rules of index division, including a randomly selected base, determine connection points and positions based on the comparison of two numbers, construct a polygon, and display relevant index operation results and text explanations to show the geometric meaning of index division.
The prompt above was compiled from the original drawing commands and is for reference only.