
IM Algebra 1 Unit 1.8 Practice: Spreadsheet Shortcuts
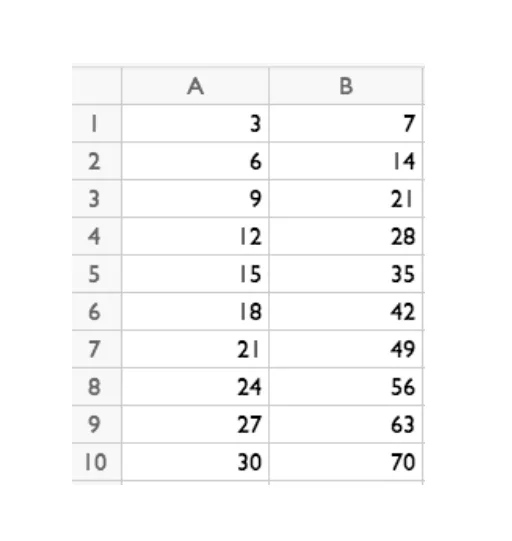
Loading the math board and drawing, please wait…
①This example demonstrates how to use spreadsheet shortcuts in GeoGebra for data manipulation and quick calculations, combined with graphical representations of mathematical concepts. ②Core math concepts include median, box plots, dilation (scaling), and parametric curves, covering introductory statistics and geometric transformations. ③Construction: Based on the summary, objects A, B, and image pic1 are used; likely involves entering data in the spreadsheet to generate box plots, or using parametric curves and dilations for dynamic demonstrations. GeoGebra commands include spreadsheet shortcuts, creation of geometric objects, and transformations. ④Suitable for upper middle school or high school students to practice spreadsheet applications in mathematical modeling and to understand statistical charts and geometric transformations visually.
GeoGebra Commands & Parameters
Point A(-1.3990243902439021, -6.329365853658535)Point B(4.600975609756098, -6.329365853658535)
AI Drawing Prompt Reference
In a coordinate plane, place two points on the same horizontal line: the left point at approximately (-1.4, -6.3) and the right point at approximately (4.6, -6.3). Connect them with a horizontal segment as a baseline. Then, overlay a statistical box plot showing the median and quartiles, and add a parametric curve that illustrates a scaling transformation. Arrange the elements to clearly show the relationship between the data distribution and the geometric transformation.
The prompt above was compiled from the original drawing commands and is for reference only.