
Interpreting a Single Point in a Scatter Plot: Coordinates, Randomness, and Mean
Loading the math board and drawing, please wait…
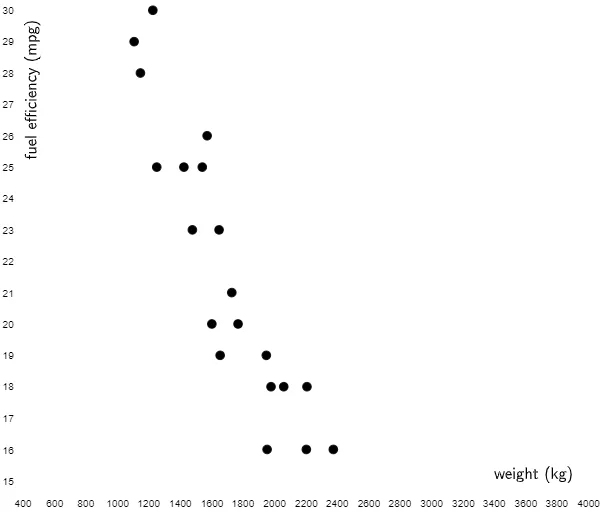
This example demonstrates how a single point in a scatter plot should be read and interpreted by its geometric position on the coordinate plane, connecting that position to the underlying numerical meaning of the data. It focuses on core ideas from coordinate geometry (reading x- and y-coordinates), probability & statistics (random-variable style data interpretation), and arithmetic mean as a way to build intuition about the data’s overall center. Visually, the construction relies on rotating on-screen labels and explanatory text to fit the layout using the RotateText command, applied to multiple text and marker objects including text1, text2, B1–B20, and A2–A19. The lesson is well suited for middle school through early high school students, and for learners using scatter plots in introductory statistics or data literacy contexts.
GeoGebra Commands & Parameters
RotateText("fuel efficiency (mpg)", π / 2) → text2
AI Drawing Prompt Reference
Draw a scatter plot on a coordinate plane showing a single point. The point's position relates to its x and y coordinates, representing data values. Rotated labels around the point provide context. The layout should be clear to understand the point's location and its relation to the axes. Keep the design simple for easy observation of the point's center.
The prompt above was compiled from the original drawing commands and is for reference only.