
IM 6.8.15 Practice: Quartiles and Interquartile Range
Loading the math board and drawing, please wait…
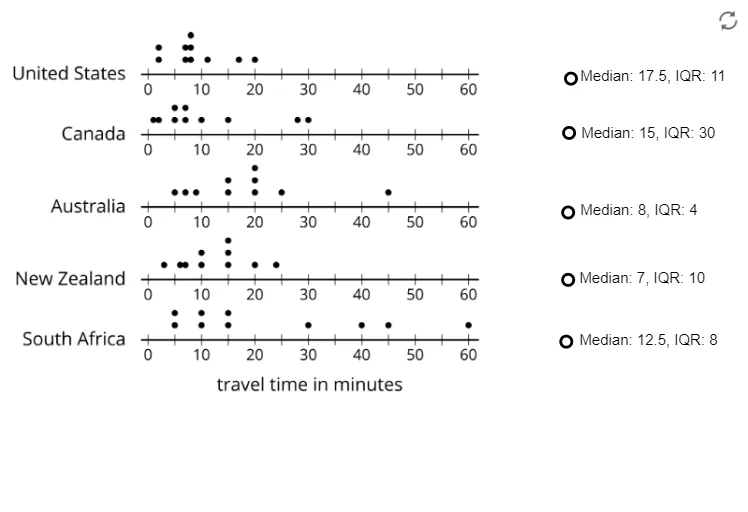
This example demonstrates how to calculate quartiles and interquartile range. Key mathematical concepts include data grouping and statistical analysis. Using GeoGebra commands like objects A and B, the distribution of data is visually displayed. Suitable for upper elementary or lower middle school students to learn basic statistics.
GeoGebra Commands & Parameters
Point A(-9, 2)Point B(0, 2)Point H(1.6821063673213164, 3.0478743051323014)Point I(1.7181583714043036, 4.237590439870879)Point J(1.7181583714043036, 5.535462586858418)Point K(1.7361843734457973, 7.067672760385374)Point L(1.7722363775287846, 8.113180878792003)
AI Drawing Prompt Reference
Draw a statistical chart with multiple points to show data distribution. Start from the lower left corner, place one point at x=-9 and another at x=0 with the same height. Then sequentially place other points with increasing x-coordinates and heights to form a polyline, representing the data distribution.
The prompt above was compiled from the original drawing commands and is for reference only.