
Hypothesis Testing Example
Loading the math board and drawing, please wait…
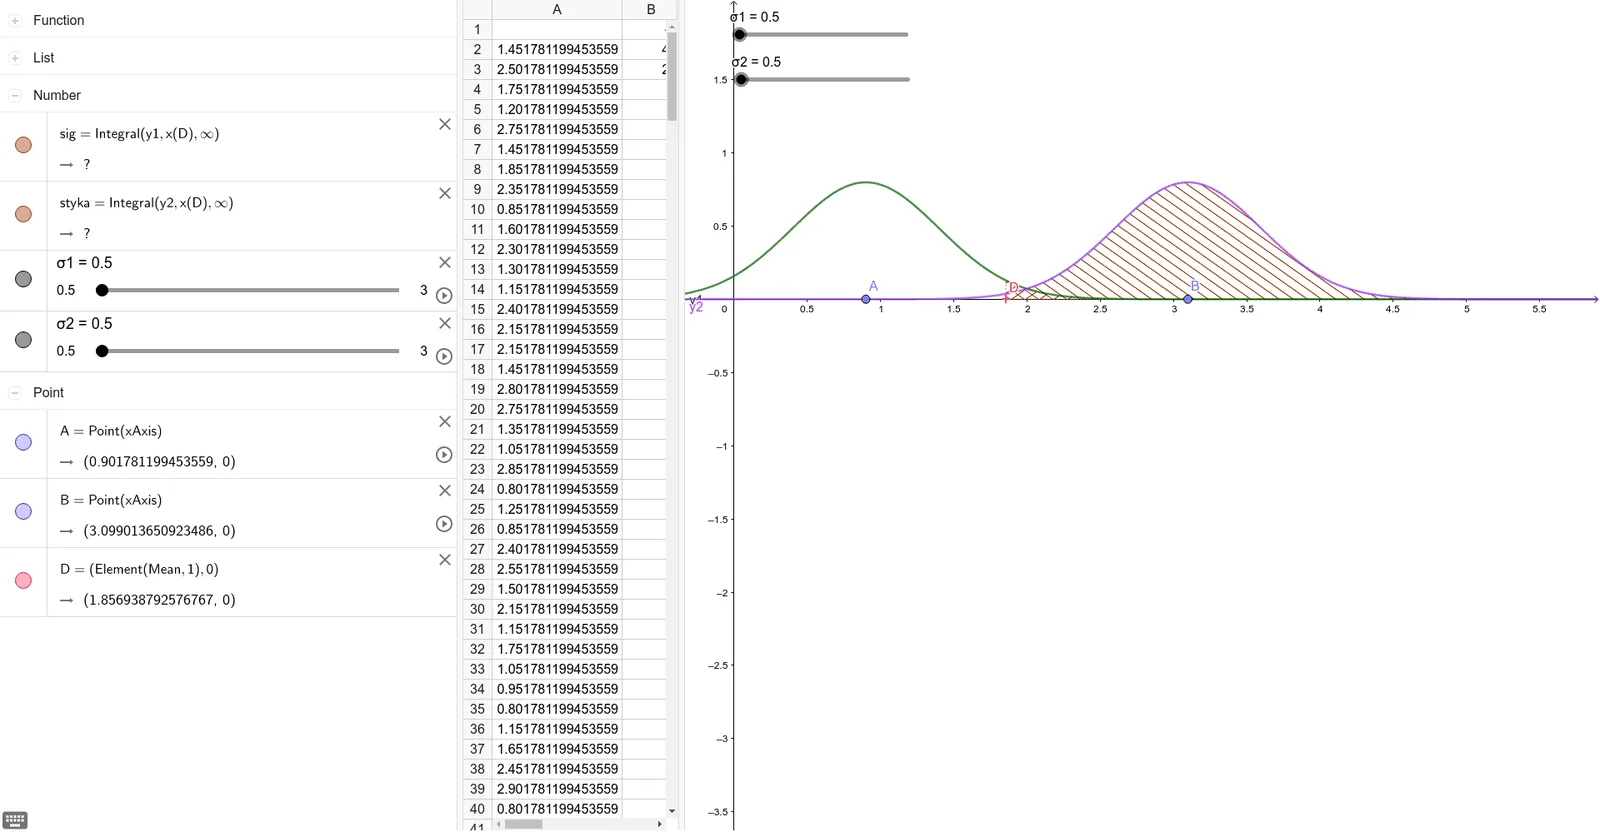
This example demonstrates the fundamental process of hypothesis testing and statistical inference. Key math concepts include probability & statistics, normal distribution, mean testing, and integral calculations. GeoGebra commands and objects used in construction are Mean, Point, Integral, among others. Suitable for high school students and math enthusiasts learning statistical inference methods.
GeoGebra Commands & Parameters
Mean(A1:A350) → D1Point(xAxis) → APoint(xAxis) → BIntegral(y2, x(D), Infinity) → stykaIntegral(y1, x(D), Infinity) → sig
AI Drawing Prompt Reference
Draw a statistical graph showing the process of hypothesis testing, including a horizontal axis and two normal distribution curves. Mark two points on the axis, calculate and display the integral areas under both curves from one point to infinity, represent the sizes of the two integral areas with points, and label the numerical values of the integral areas.
The prompt above was compiled from the original drawing commands and is for reference only.