
Hyperbola Graphing
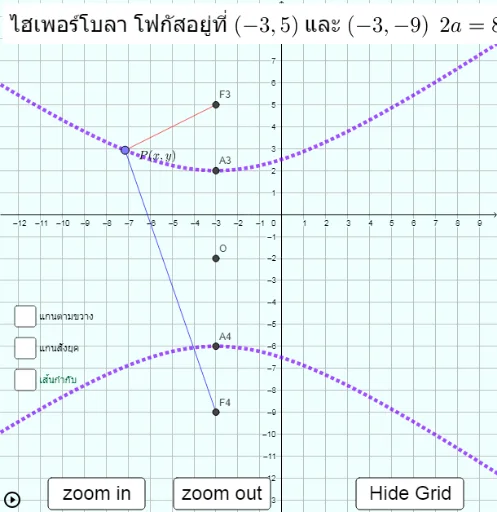
Loading the math board and drawing, please wait…
This example demonstrates the graphing of hyperbolas and their properties, involving core math concepts like hyperbola definition, foci, asymptotes, and coordinate geometry. Construction highlights include GeoGebra commands such as Hyperbola, Circle, Line, Intersect, Segment, Midpoint, Polygon, Point, and SurdText. Suitable for high school mathematics education and learning to understand the geometric and algebraic characteristics of hyperbolas.
GeoGebra Commands & Parameters
Hyperbola(F2, F1, A1) → dHyperbola(F3, F4, A4) → eIf(h ≟ 0, "x²", "(" + f + ")²") → txIf(k ≟ 0, "y²", "(" + g + ")²") → tyCircle(O, F3) → pLine(A3, xAxis) → lLine(A4, xAxis) → mIntersect(p, l) → A, BIntersect(p, m) → C, DSegment(A, B) → qSegment(D, B) → rSegment(A, C) → sSegment(D, C) → tLine(C, B) → f_1Line(A, D) → g_1Midpoint(A, C) → EMidpoint(B, D) → FSegment(A3, A4) → h_1Segment(E, F) → i_1Circle(O, F1) → c_1Line(A1, yAxis) → j_1Line(A2, j_1) → k_1Intersect(c_1, k_1) → G, HIntersect(c_1, j_1) → I, JLine(G, J) → l_1Line(H, I) → m_1Polygon(H, G, I, J) → q1, h_2, g_2, i_2, j_2Midpoint(H, J) → KMidpoint(G, I) → LSegment(K, L) → n_1Segment(A2, A1) → p_1Point(d) → MSegment(F2, M) → q_1Segment(M, F1) → r_1Point(e) → NSegment(F3, N) → s_1Segment(N, F4) → t_1If(Mod[b, 1] ≟ 0, "" + b, text14) → boSurdText(a / b) → text16SurdText(b / a) → text17
AI Drawing Prompt Reference
Draw a hyperbola with foci at points F1 and F3, and vertices at points A1 and A4, using the Hyperbola command to create hyperbolas d and e. Draw lines from the foci to the vertices, construct the asymptotes, mark the foci and vertices, and display the eccentricity and equations of the asymptotes.
The prompt above was compiled from the original drawing commands and is for reference only.