
How Standard Deviation Shapes the Normal Curve
Loading the math board and drawing, please wait…
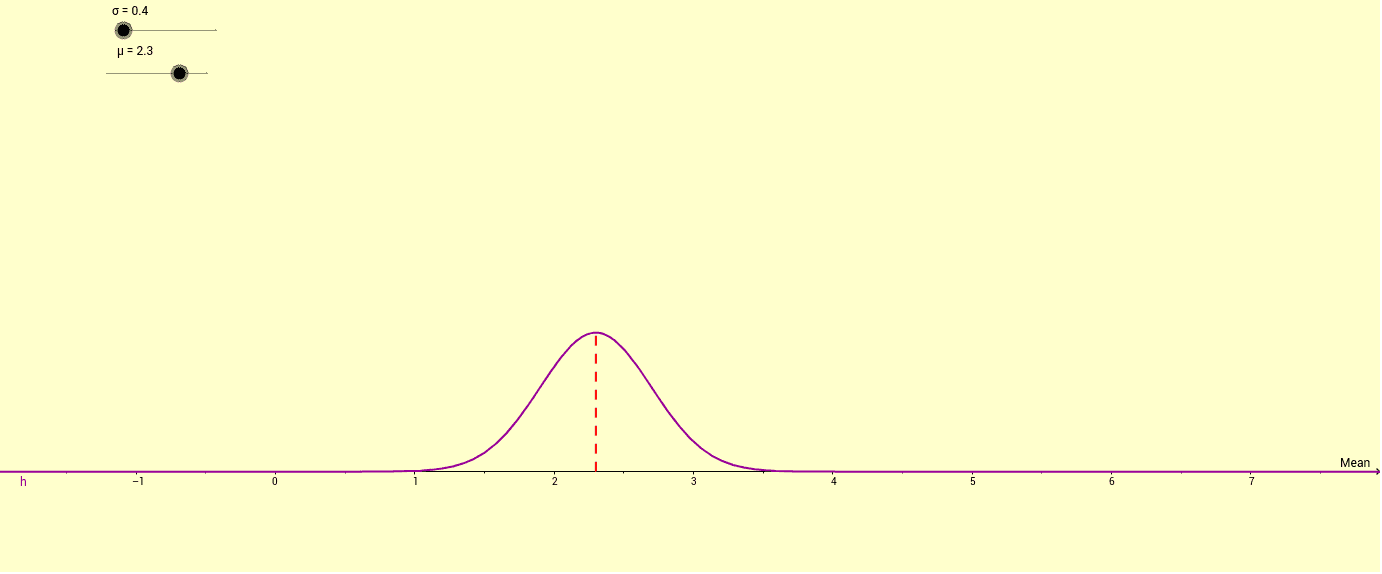
This example demonstrates how standard deviation influences the shape of a normal distribution curve. Key math concepts include normal distribution, standard deviation, and curve sketching. It is constructed using GeoGebra's Intersect and Segment commands, with objects like σ (standard deviation), μ (mean), h (height), and a, A, B, b for interactive exploration. Suitable for high school students and math enthusiasts studying probability & statistics and calculus.
GeoGebra Commands & Parameters
Intersect(h, a, (2.3, 0.997370408612152)) → AIntersect(a, xAxis) → BSegment(B, A) → b