
How Slope-Intercept Form Changes
Loading the math board and drawing, please wait…
In collections
UNIT 2 LINEAR FUNCTIONS
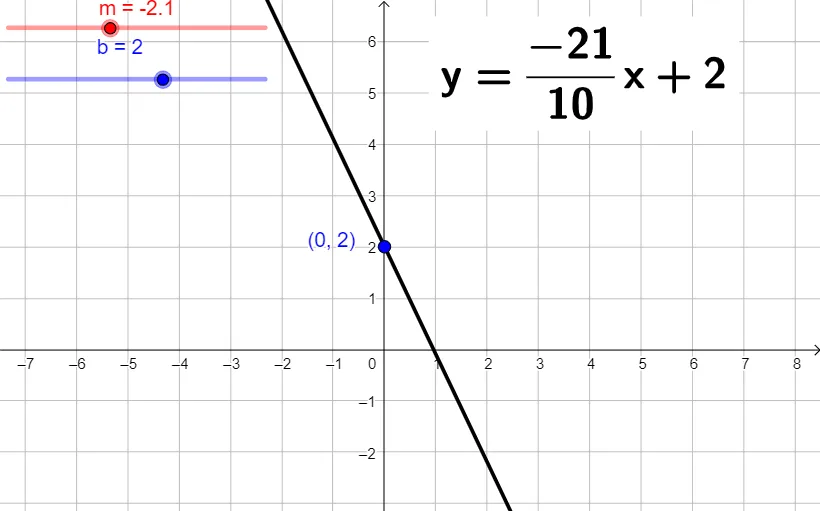
This example demonstrates how the slope-intercept form of a linear equation changes with variations in slope (m) and y-intercept (b). It involves core math concepts like the slope-intercept equation of a line, the graph of a line, and the significance of slope and intercept. The construction uses GeoGebra commands such as Intersect to plot intersections of lines with axes and dynamically show the effects of parameters m, b, a, A on the line's graph. Suitable for high school coordinate geometry teaching to help students visually understand the geometric meaning of the slope-intercept form.
GeoGebra Commands & Parameters
Intersect(a, yAxis) → A
AI Drawing Prompt Reference
Draw a line in a coordinate plane with two sliders controlling the slope and y-intercept. The intersection point between the line and y-axis is automatically displayed. Show how the line's position changes as you adjust the slope and intercept sliders, helping visualize the geometric meaning of parameters in the slope-intercept form of a linear equation.
The prompt above was compiled from the original drawing commands and is for reference only.