
Histogram by PRABATH P
Loading the math board and drawing, please wait…
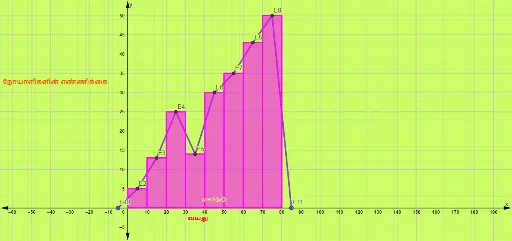
This example demonstrates how to create a histogram using GeoGebra commands such as Histogram and PolyLine. A histogram is a statistical chart that shows the distribution of data. This example is suitable for middle school mathematics education, helping students understand basic concepts of data statistics.
GeoGebra Commands & Parameters
Histogram(l1, l2) → aPolyLine(E10, E2, E3, E4, E5, E6, E7, E8, E9, E11) → f