
Histogram-Based Statistical Questions via Geometric Construction (IM 6.8.7)
Loading the math board and drawing, please wait…
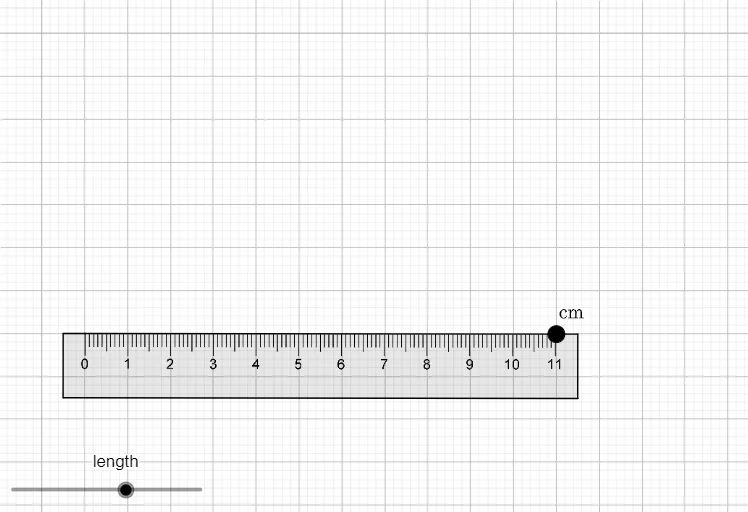
This example demonstrates how to use a histogram (a bar chart representing binned frequencies or probabilities) to answer statistical questions, linking distribution/binning ideas to a geometric construction. Key mathematical concepts include random variables, the discretization of a distribution into bins, reading frequency (or relative frequency) from histogram bars, and using interval/event logic via inequalities to interpret which outcomes fall into specific ranges. Construction-wise, the provided GeoGebra command summary shows a geometry-driven build: Point is used to create key points; UnitOrthogonalVector and UnitVector generate unit direction vectors to control orientation and layout; Polygon builds polygonal shapes that can represent the bar structure (e.g., poly1 and related figure pieces); additional objects such as ruler, intermediate points A_1, A_2, …, A_8, and grouped sub-objects (like a_3…a_8, pic5…pic15) assemble the final visualization. Suitable for upper secondary and introductory college probability & statistics, as well as data visualization lessons where students explore how interval events translate into histogram readings and statistical conclusions.
GeoGebra Commands & Parameters
Point(Circle[A_1, ruler]) → A_6UnitOrthogonalVector(Segment[A_1, A_6]) → vUnitVector(Segment[A_1, A_6]) → uPolygon(A_1, A_2, A_3, A_4, A_5, A_6) → poly1, a_3, a_4, a_5, a_6, a_7, a_8
AI Drawing Prompt Reference
Create a histogram using bars to represent frequency in different intervals, showing the distribution of random variables. Start by drawing a circle and marking points on it with a ruler, then generate orthogonal and parallel unit vectors to define directions, and finally construct multiple polygonal bars using these points and vectors to form the histogram, illustrating statistical intervals and frequency relationships.
The prompt above was compiled from the original drawing commands and is for reference only.