
Histogram and Frequency Polygon by BUHARDEEN KANSOOR RAHMAN
Loading the math board and drawing, please wait…
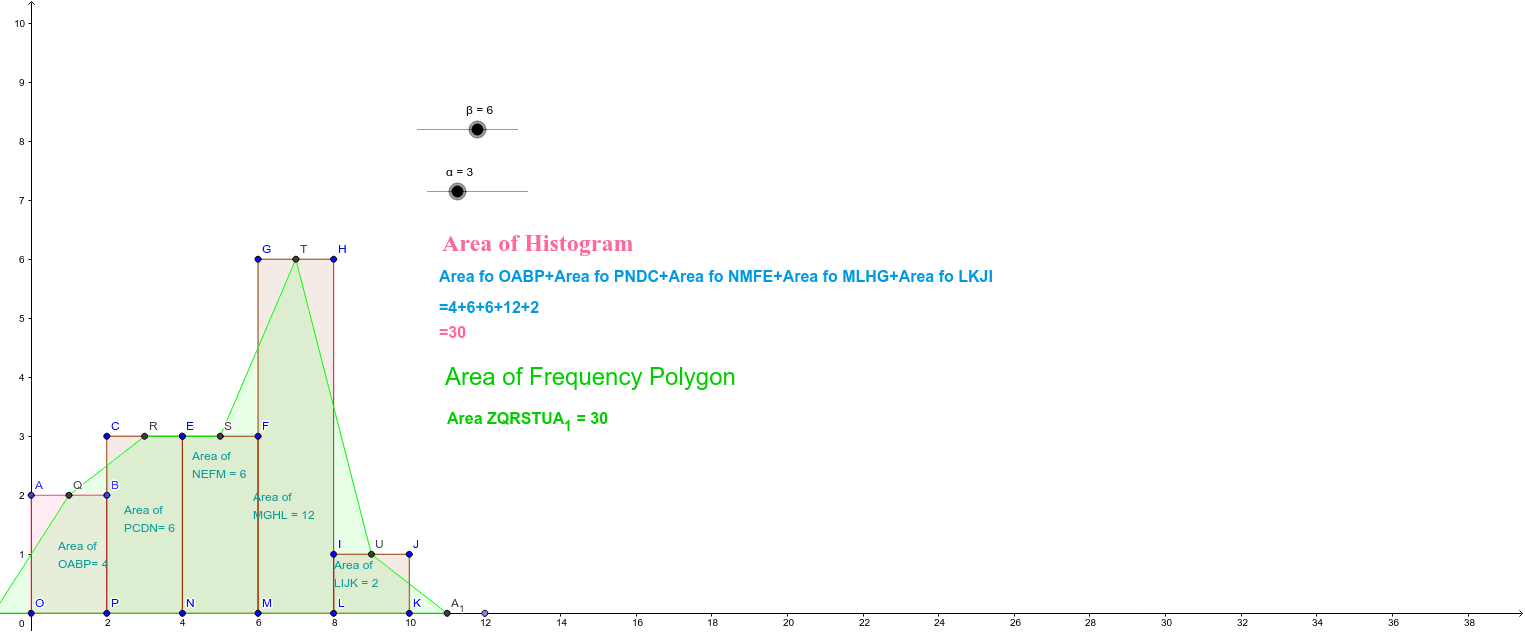
This example demonstrates the relationship between histograms and frequency polygons, where both have the same area. It involves key concepts of histograms and frequency polygons, constructed using GeoGebra commands such as Polygon, Midpoint, and Point. Suitable for middle school and above students learning about frequency distributions in statistics.
GeoGebra Commands & Parameters
Polygon(O, A, B, P) → poly1, o, a, b, pPolygon(P, C, D, N) → poly2, p_1, c, d, nPolygon(N, E, F, M) → poly3, n_1, e, f, mPolygon(M, G, H, L) → poly4, m_1, g, h, lPolygon(L, I, J, K) → poly5, l_1, i, j, kMidpoint(A, B) → QMidpoint(C, D) → RMidpoint(E, F) → SMidpoint(G, H) → TMidpoint(I, J) → UPoint(xAxis) → VPoint(xAxis) → WMidpoint(O, V) → ZMidpoint(K, W) → A_1Polygon(Z, Q, R, S, T, U, A_1) → poly6, z, q, r, s, t, u, a_1
AI Drawing Prompt Reference
Draw a histogram and a frequency polygon, consisting of five rectangles and a polygon connecting the midpoints of these rectangles. First, draw the five rectangles, then connect the midpoints of each rectangle to form the frequency polygon. Finally, draw two points on the x-axis and connect them to the midpoints of the histogram's base to form another polygon.
The prompt above was compiled from the original drawing commands and is for reference only.