
Higher-Order Derivative Test
Loading the math board and drawing, please wait…
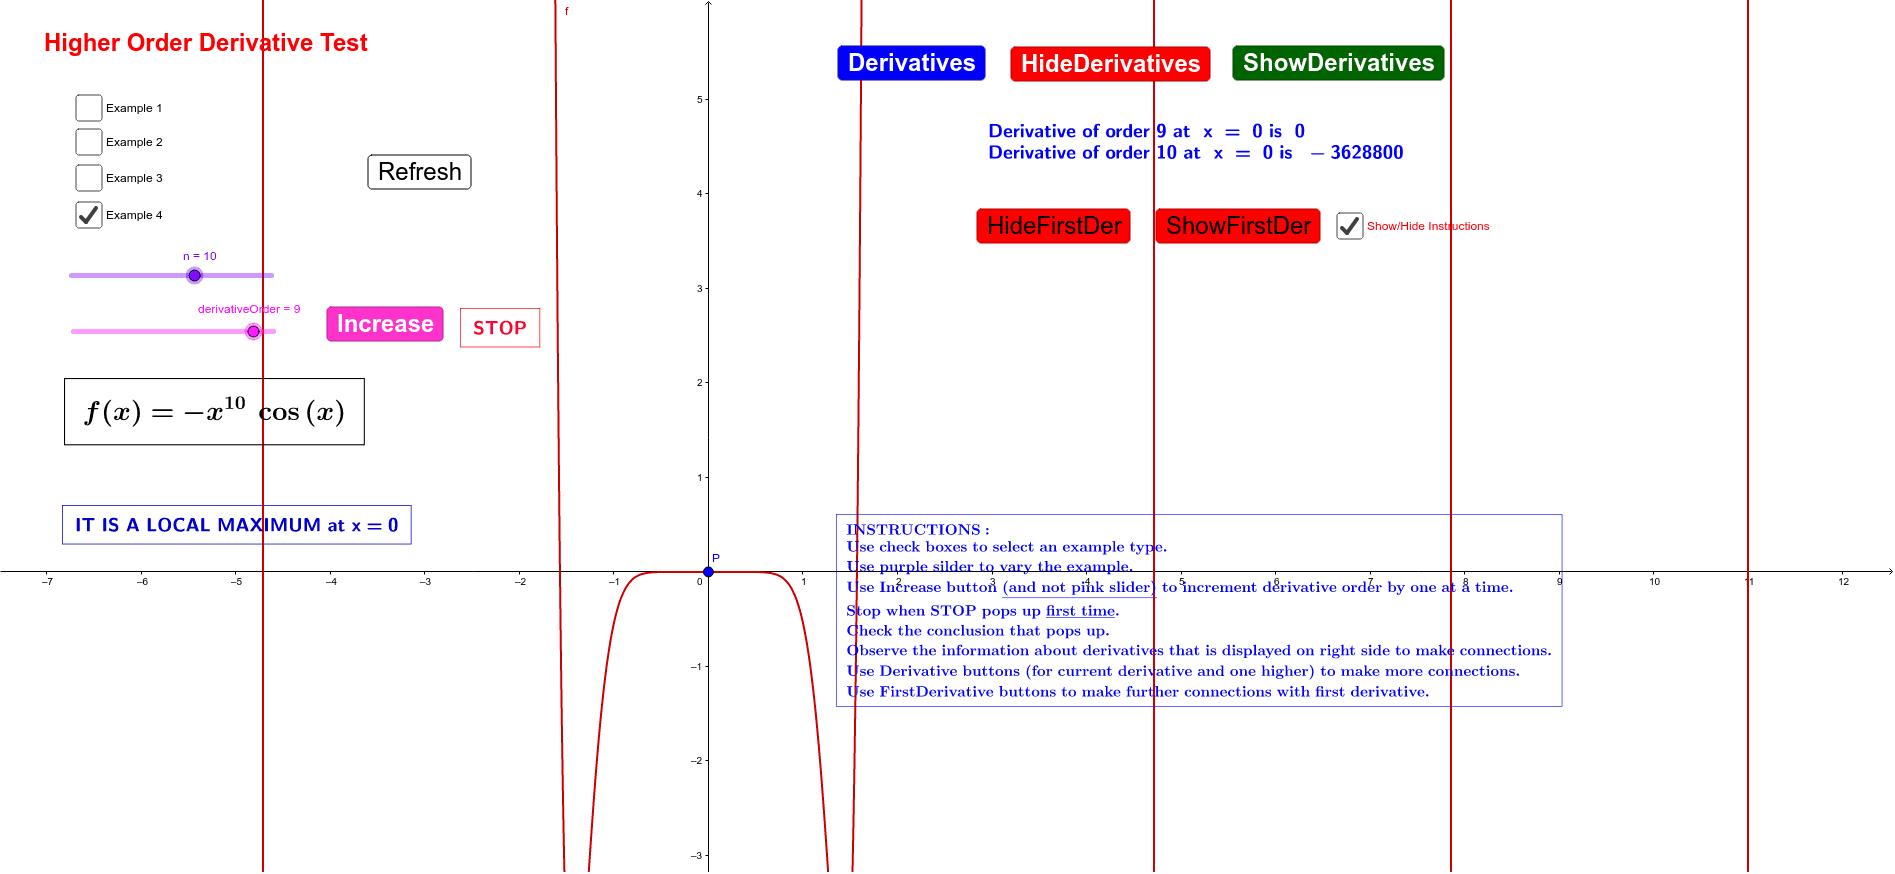
This example demonstrates how to determine the nature of a critical point using higher-order derivatives when first and second derivatives vanish. It involves concepts like critical points, first and second derivatives, and the higher-order derivative test. Constructed using GeoGebra commands like RandomElement, Simplify, If, Derivative, Mod, Length. Suitable for university calculus instruction or student exploration.
GeoGebra Commands & Parameters
RandomElement(lst4) → ooRandomElement(lst2) → lRandomElement(lst3) → kSimplify((x^(n) * oo(x))) → oRandomElement(lst1) → uRandomElement(lst1) → vRandomElement(lst1) → wIf(a ≟ true, p, If[b ≟ true, q, If[c ≟ true, r, o]]) → fDerivative(f, derivativeOrder) → gDerivative(f, derivativeOrder + 1) → hMod(derivativeOrder, 2) → remLength(LST) → len
AI Drawing Prompt Reference
Create a visualization for the higher-order derivative test, featuring a randomly selected function with both first and second derivatives vanishing at a critical point. Show the function value, first derivative, and second derivative at this point, distinguished by different colors. Start by plotting the function curve, then mark the critical point, draw the first and second derivative curves, and finally determine the nature of the critical point using the higher-order derivative test, marking it with distinct colors.
The prompt above was compiled from the original drawing commands and is for reference only.