
Hello Kitty - Sine Graph - Public
Loading the math board and drawing, please wait…
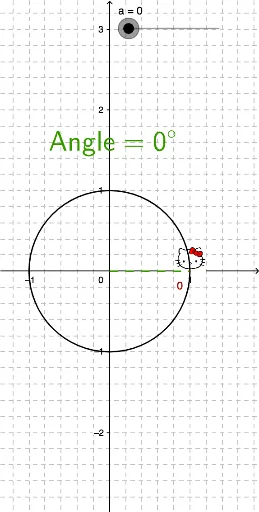
① This example combines the Hello Kitty cartoon character with a sine function graph to visually demonstrate the periodic oscillating nature of the sine curve, serving as a playful integration of mathematics and art. ② Core mathematical concepts include the sine function (y = sin x), its graph, period, amplitude, and transformations; it also involves geometric objects such as points, segments, and angles interacting with the function graph. ③ Construction highlights: Based on the construction summary, GeoGebra commands such as Intersect, Segment, and Angle are used, along with multiple points (A, B, C, D, E, F, G, H, J, I, K), segments (a, b, c, d), an angle (α), text objects (text1, text2_2, text2, text3, text4, text5), and image objects (pic1, pic2). The sine curve and cartoon overlay are built by linking points and segments. ④ Suitable for middle and high school students learning trigonometric graphs, as well as for interdisciplinary activities combining mathematics with visual arts, helping learners understand the correspondence between function graphs and geometric constructions.
GeoGebra Commands & Parameters
Intersect(xAxis, yAxis) → DSegment(D, A) → bIntersect(c, xAxis, 1) → CSegment(D, C) → dAngle(xAxis, b) → αSegment(E, A) → e