
Geometric construction of the tangent function on [-π/2, π/2]
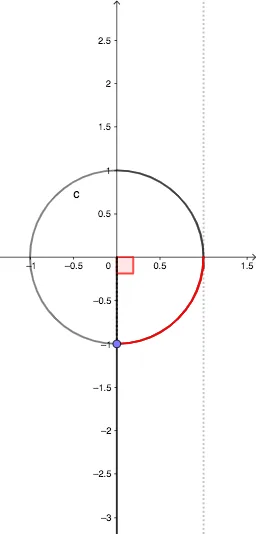
Loading the math board and drawing, please wait…
This example demonstrates how the tangent function on the interval [-π/2, π/2] can be visualized through a geometric construction that links an angle α to an appropriate slope/ratio. It emphasizes the geometric meaning of tan(α), the relationship between angles and right-triangle/circle geometry, and how varying an angle produces a function behavior on a restricted domain. Construction is driven by GeoGebra commands indicated in the summary: Semicircle to set up the circular/semicircular scaffold; Point to create key points (e.g., A, B, C, D, and many auxiliary points); Intersect to compute intersection points that define the segment/line placements; If to select or adjust configurations depending on the angle; Segment and Ray to build the required lines whose geometry encodes the tangent relationship; and Angle to measure and control the driving angle α. Intended for high school and early university learners studying trigonometry and graphing via dynamic geometric insight, useful for classroom demonstrations and self-guided exploration.
GeoGebra Commands & Parameters
Semicircle((0, 1), (0, -1)) → ePoint(e) → AIntersect(c, xAxis, 2) → BIf(y(A) > 0, CircleArc[(0, 0), B, A], CircleArc[(0, 0), A, B]) → dIntersect(xAxis, yAxis) → CSegment(C, A) → gRay((0, 0), A) → iIntersect(h, i) → DSegment(A, (x(A), 0)) → jSegment(B, D) → kAngle(A, C, B) → αIf(y(A) < 0, (-d), d) → d1Segment((d1, 0), (0, 0)) → mSegment(D, (10, y(D))) → n
AI Drawing Prompt Reference
Draw the tangent function graph on the interval [-π/2, π/2]. Start by drawing a unit semicircle, then take point A on the semicircle and point B on the x-axis, and construct arc d with A and B. Take point C at the origin, draw line segment g from C to A, and draw ray i from the origin, intersecting arc d at point D. Draw line segment j from A to (x(A), 0), and line segment k from B to D. Measure angle α. Adjust arc d's direction based on the sign of α to get d1, and draw line segment m from the endpoint of d1 to the origin. Draw line segment n from D to the right of the x-axis.
The prompt above was compiled from the original drawing commands and is for reference only.