
Harmonic Mean Demonstration
Loading the math board and drawing, please wait…
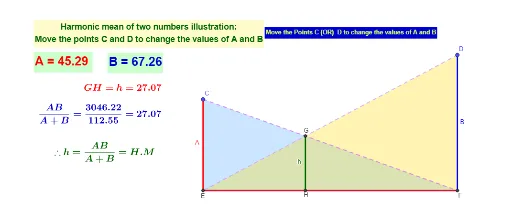
This example dynamically visualizes the geometric relationship between points and lines to illustrate the concept of harmonic mean; involves core math concepts like harmonic mean, functions, slope, and mean inequality; constructed using GeoGebra commands/objects such as Line, OrthogonalLine, Intersect, Segment, Polygon; suitable for high school mathematics teaching to understand mean inequality and function properties.
GeoGebra Commands & Parameters
Line(A, B) → fOrthogonalLine(C, f) → gOrthogonalLine(D, f) → hIntersect(g, f) → EIntersect(h, f) → FSegment(C, F) → iSegment(D, E) → jSegment(C, E) → kSegment(D, F) → lSegment(E, F) → mIntersect(j, i) → GOrthogonalLine(G, m) → nIntersect(n, m) → HSegment(G, H) → pPolygon(C, E, F) → t1, f_1, c_1, ePolygon(E, F, D) → t2, d, e_1, f_2