
Graphs of Trigonometric Functions
Loading the math board and drawing, please wait…
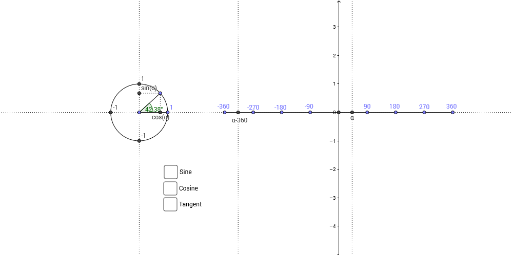
This example demonstrates the graphs of trigonometric functions, including sine, cosine, and tangent functions. Using GeoGebra commands such as Point, Circle, Segment, Angle, and Intersect, the graphs can be dynamically adjusted to observe changes in the functions' symmetry and periodicity. Suitable for high school mathematics education and learning.
GeoGebra Commands & Parameters
Point(xAxis) → APoint(xAxis) → BCircle(A, B) → cPoint(c) → CSegment(A, C) → aAngle(B, A, C) → αSegment(A, B) → bIntersect(xAxis, yAxis) → DPoint(xAxis) → ESegment(D, E) → dPoint(xAxis) → FPoint(xAxis) → GSegment(F, G) → ePoint(xAxis) → HSegment(H, G) → fSegment(E, F) → gPoint(xAxis) → ISegment(D, I) → hPoint(xAxis) → JSegment(I, J) → iPoint(xAxis) → KSegment(J, K) → jPoint(xAxis) → LSegment(K, L) → kOrthogonalLine(A, xAxis) → lOrthogonalLine(B, xAxis) → mLine(A, B) → nIntersect(c, l, 2) → UIntersect(c, n, 2) → VIntersect(c, l, 1) → WOrthogonalLine(C, n) → pOrthogonalLine(C, l) → qLine(A, C) → rIntersect(l, q) → ZSegment(C, Z) → sIntersect(n, p) → A_1Segment(C, A_1) → tIntersect(m, r) → B_1Segment(A, B_1) → a_1Circle(A, A_1) → c_1Intersect(c_1, l, 2) → C_1OrthogonalLine(C_1, l) → b_1OrthogonalLine(B_1, m) → d_1Line(N, P) → e_1OrthogonalLine(M, d) → f_1
AI Drawing Prompt Reference
Draw a coordinate plane with a horizontal and a vertical axis. Place two points on the horizontal axis, and draw a circle centered at one point passing through the other. Mark a point on the circle, connect it to the center to form a radius, and indicate the angle at the center between the horizontal axis and this radius. Then place several points along the horizontal axis and connect consecutive points with segments, creating a series of intervals. From the center and another point on the axis, draw perpendicular lines to the axis, and also draw a line through these two points. Mark intersections of the circle with these perpendiculars and the line. From the point on the circle, draw perpendiculars to the horizontal axis and to the line through the two axis points, and connect the resulting intersection points with segments to form a geometric configuration related to trigonometric graphs.
The prompt above was compiled from the original drawing commands and is for reference only.