
Graphs of Logarithmic and Exponential Functions
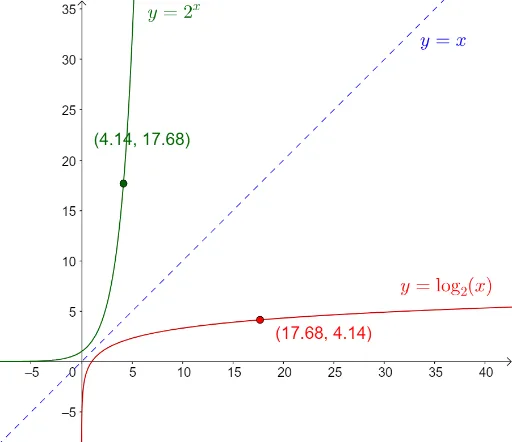
Loading the math board and drawing, please wait…
This example demonstrates the plotting and characteristics of logarithmic and exponential functions. Key math concepts include the domain, range, monotonicity of logarithmic functions, and the exponential nature, growth, and decay of exponential functions. Construction highlights involve using GeoGebra's Point and Mirror commands, with objects f, g, A, h, B for function graphs and parameter control, and text1, text2, text3 for annotations. Suitable for high school mathematics education to visually aid students in understanding the graphical features and relationships between logarithmic and exponential functions.
GeoGebra Commands & Parameters
Point(f) → AMirror(A, h) → B