
Graphing Translated Exponential Functions
Loading the math board and drawing, please wait…
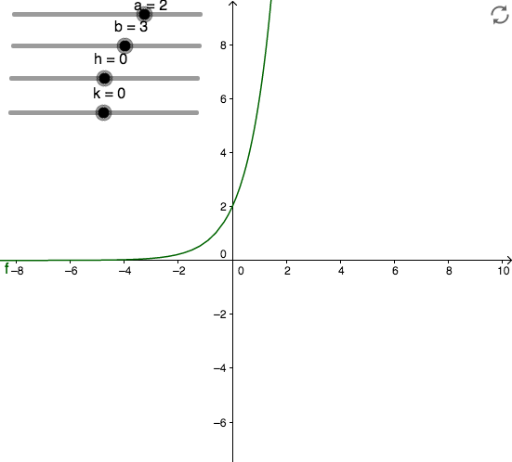
This example demonstrates the graphing of translated exponential functions, covering concepts like exponential functions, function translations, and coordinate systems. It uses GeoGebra commands/objects a, b, h, k, f to represent the base of the exponential function, translation vector, and vertex coordinates. Suitable for high school mathematics teaching and understanding function transformation properties.
GeoGebra Commands & Parameters
Numeric a(2)Numeric b(3)Numeric h(0)Numeric k(0)f(x) = (a * b^(x - h)) + k
AI Drawing Prompt Reference
Graph an exponential function with a base of 2 and a coefficient of 3, showing no translation along the x-axis or y-axis (translation vector (0,0)), with the vertex at the origin (0,0). Display the basic shape of the exponential function and its position in the coordinate system.
The prompt above was compiled from the original drawing commands and is for reference only.