
Graphing Sine and Cosine using the Unit Circle by Emma
Loading the math board and drawing, please wait…
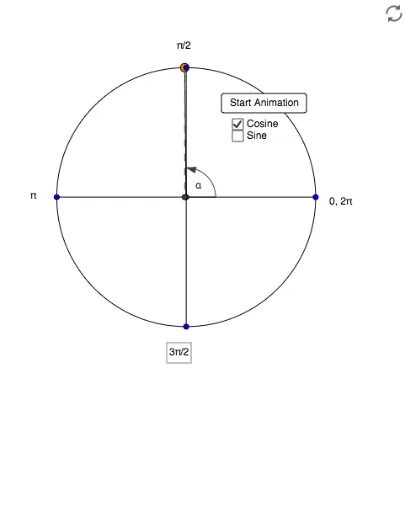
This example demonstrates how to graph sine and cosine functions using the unit circle. It involves core math concepts like the unit circle, trigonometric functions, and coordinate geometry. GeoGebra commands used include Intersect, Circle, Point, Segment, and Angle. Suitable for high school students learning about the generation of trigonometric function graphs.
GeoGebra Commands & Parameters
Intersect(xAxis, yAxis) → ACircle(A, 1) → cPoint(c) → BSegment(A, B) → aAngle(C, A, B) → αSegment(D, F) → bSegment(E, C) → dSegment(A, G) → eSegment(B, G) → hSegment(B, H) → iSegment(J, I) → jSegment(I, L) → kSegment(B, G) → p
AI Drawing Prompt Reference
Draw a unit circle centered at the origin. Place a point on the circle and connect it to the center with a radius. Draw a horizontal radius as the initial side and construct an angle, showing its measure. From the point on the circle, drop perpendiculars to the horizontal and vertical axes to obtain sine and cosine segments. Then draw a horizontal axis and map the angle from the circle to the x-coordinate, while plotting the sine and cosine values as y-coordinates, producing two wavy function curves.
The prompt above was compiled from the original drawing commands and is for reference only.