
Graphing Rational Numbers on a Horizontal Line
Loading the math board and drawing, please wait…
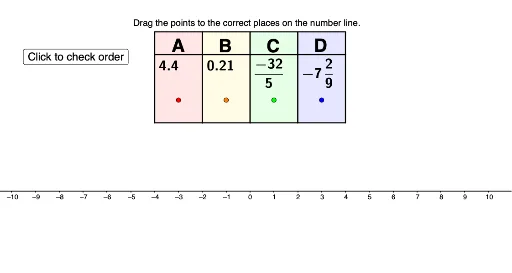
This example demonstrates plotting rational numbers on a horizontal line, illustrating the geometric representation of rational numbers and their probabilistic distribution. Key mathematical concepts include rational number definition, coordinate system application, and random variable generation. Construction involves GeoGebra commands like RandomElement, If, Polygon, etc. Suitable for middle school students learning rational numbers and probability basics, useful as a teaching aid.
GeoGebra Commands & Parameters
RandomElement({2, 3, 4, 5, 6, 7, 8, 9, 10, 11, 12}) → CdenomIf(Cdenom ≟ 2, Random[-20, 20, true], If[Cdenom ≟ 3, Random[-30, 30, true], If[Cdenom ≟ 4, Random[-40, 40, true], If[Cdenom ≟ 5, Random[-50, 50, true], If[Cdenom ≟ 6, Random[-60, 60, true], If[Cdenom ≟ 7, Random[-70, 70, true], If[Cdenom ≟ 8, Random[-80, 80, true], If[Cdenom ≟ 9, Random[-90, 90, true], If[Cdenom ≟ 10, Random[-100, 100, true], If[Cdenom ≟ 11, Random[-110, 110, true], If[Cdenom ≟ 12, Random[-120, 120, true]]]]]]]]]]]) → CnumPolygon(I, W, V, J) → poly1, i, w, v, jPolygon(J, V, U, K) → poly2, j_1, v_1, u, kPolygon(K, U, T, L) → poly3, k_1, u_1, t, lPolygon(L, T, S, M) → poly4, l_1, t_1, s, mSegment(H, G) → cSegment(G, Z) → dSegment(Z, E) → eSegment(E, F) → fFractionText(C) → CfancyRandomElement({2, 3, 4, 5, 6, 7, 8, 9, 10, 11, 12}) → DdenomRandomElement({-9, -8, -7, -6, -5, -4, -3, -2, -1, 1, 2, 3, 4, 5, 6, 7, 8, 9}) → DwholeRandom(1, Ddenom - 1, true) → DnumFractionText(Dnum / Ddenom) → DfancyIf(Dwhole < 0, Dwhole - Dnum / Ddenom, Dwhole + Dnum / Ddenom) → DSegment(A_1, Aact) → aerrSegment(B_1, Bact) → berrSegment(C_1, Cact) → cerrSegment(D_1, Dact) → derrSort({A, B, C, D}) → testSort({x(A_1), x(B_1), x(C_1), x(D_1)}) → test2If(IndexOf[A, Sort[{A, B, C, D}]] ≟ IndexOf[x(A_1), Sort[{x(A_1), x(B_1), x(C_1), x(D_1)}]], 1) → orderAIf(IndexOf[B, Sort[{A, B, C, D}]] ≟ IndexOf[x(B_1), Sort[{x(A_1), x(B_1), x(C_1), x(D_1)}]], 1) → orderBIf(IndexOf[C, Sort[{A, B, C, D}]] ≟ IndexOf[x(C_1), Sort[{x(A_1), x(B_1), x(C_1), x(D_1)}]], 1) → orderCIf(IndexOf[D, Sort[{A, B, C, D}]] ≟ IndexOf[x(D_1), Sort[{x(A_1), x(B_1), x(C_1), x(D_1)}]], 1) → orderD
AI Drawing Prompt Reference
Draw a series of rational number points on a horizontal line. Connect the points with line segments to form a continuous graph. Label each point with a fraction text to show its value. The overall layout should be simple and reflect the geometric representation and probability distribution of rational numbers, suitable for a teaching demonstration.
The prompt above was compiled from the original drawing commands and is for reference only.