
Graphing Quadratic Functions - Intercept Form 1
Loading the math board and drawing, please wait…
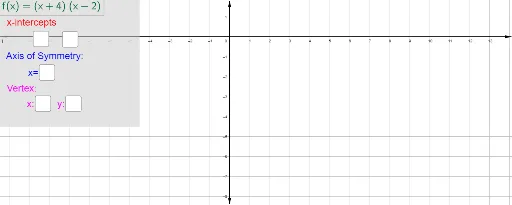
① This example demonstrates how to graph a quadratic function in intercept form (factored form) by inputting parameters, and visually shows the parabola's intersections with the x-axis. ② The core mathematical concept is the intercept form of a quadratic function: y = a(x - m)(x - n), where m and n are the x-coordinates of the x-intercepts, and a controls the direction and width of the parabola; it also involves coordinate geometry, function graphing, and intersection points. ③ Construction highlights: The GeoGebra commands used include Textfield and inputBox to create interactive input fields for parameters a, m, and n; Polygon and Intersect to construct auxiliary shapes and mark intersection points; multiple text objects (text1 to text5) dynamically display the function expression and intersection coordinates; the overall setup provides a dynamic, parameter-adjustable graphing environment. ④ This is suitable for upper middle school or high school students to understand the geometric meaning of the intercept form of quadratic functions, and can serve as an interactive tool for classroom demonstrations or self-exploration, bridging algebraic expressions and visual graphs.
GeoGebra Commands & Parameters
Textfield(a) → inputBox1Textfield(b) → inputBox2Textfield(c) → inputBox3Textfield(d) → inputBox4Polygon(G, H, I, J) → poly1, g_1, h, i, jTextfield(k) → inputBox5Intersect(f, l, 1) → AIntersect(f, l, 2) → K