
Graphing Quadratic Functions by Kristie Herald
Loading the math board and drawing, please wait…
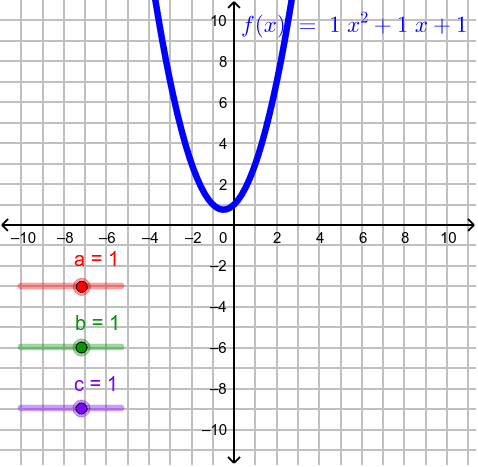
This example demonstrates how to graph quadratic functions. Quadratic functions form parabolas, and adjusting the coefficients of the function changes the direction and position of the parabola. The Intersect command is used to find the intersection points of the function graph and a line. Suitable for students at the middle school level and above to learn about the properties and transformations of quadratic functions.
GeoGebra Commands & Parameters
Intersect(f, xAxis, 1) → AIntersect(f, xAxis, 2) → B