
Graphing Quadratic Functions by Jian.Sun
Loading the math board and drawing, please wait…
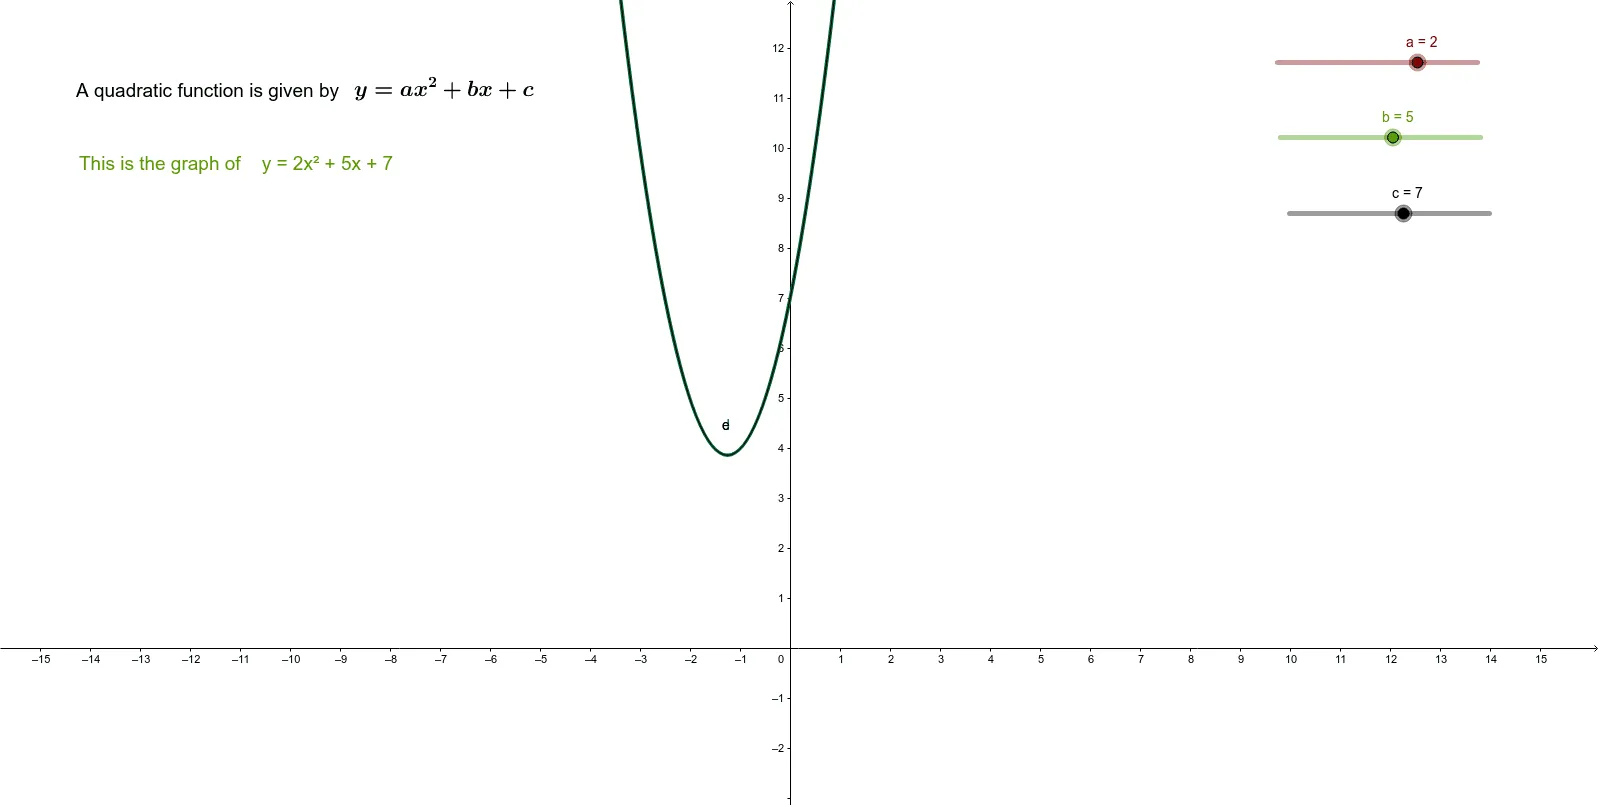
This example demonstrates how to plot the graph of a quadratic function y=ax²+bx+c by adjusting coefficients a, b, c. Key math concepts include properties of quadratic functions, the effect of coefficients on graph shape, roots, axis of symmetry, and vertex coordinates. Construction highlights involve using GeoGebra objects a, b, c to control coefficients, while text1, text2, text3, text4 display key information like function expression, vertex, and roots. The slider d assists in drawing the axis of symmetry. Suitable for high school mathematics teaching to understand quadratic function graph characteristics and coefficient variation patterns.
GeoGebra Commands & Parameters
Numeric a(2.0)Numeric b(5.0)Numeric c(7.0)y = (a * x^(2)) + (b * x) + cy = (a * x^(2)) + (b * x) + c