
Graphing Quadratic Functions by Bruce Wagner
Loading the math board and drawing, please wait…
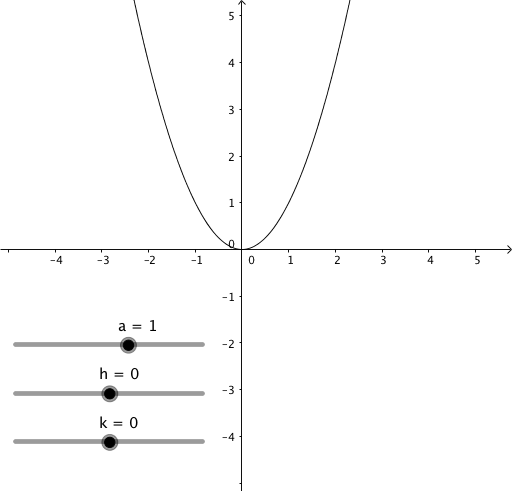
This example demonstrates how to plot quadratic function graphs by adjusting parameters a, h, k. It covers key math concepts like vertex form, axis of symmetry, and the effect of parameters on the graph. GeoGebra commands a, h, k, f are used to visualize dynamic changes. Suitable for high school math education and understanding transformations of quadratic function graphs.
GeoGebra Commands & Parameters
Numeric a(1.0)Numeric h(0.0)Numeric k(0.0)y = (a * (x - h)^(2)) + k