
Graphing Polar Coordinates
Loading the math board and drawing, please wait…
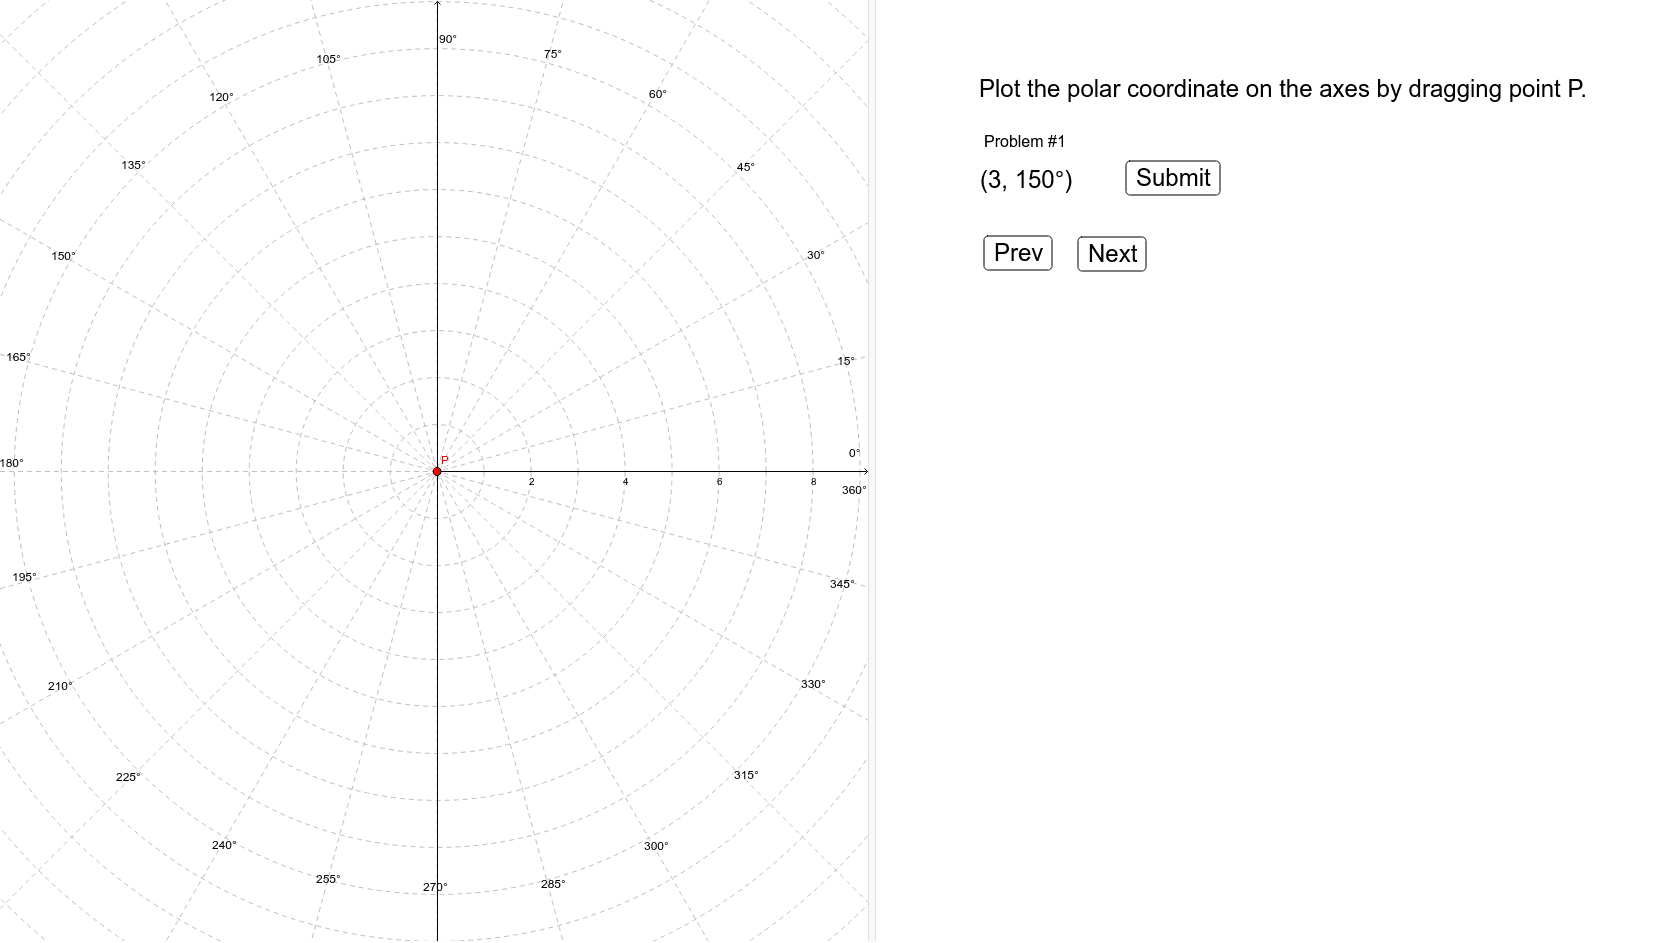
This example demonstrates how to plot points in polar coordinates, involving core concepts like polar radius and angle. It uses commands like Segment and Angle from GeoGebra for construction, suitable for high school students learning polar coordinate applications.
GeoGebra Commands & Parameters
Segment(K, L) → aSegment(M, L) → bAngle(M, L, K) → α
AI Drawing Prompt Reference
Draw a shape consisting of two line segments and an angle, where one segment connects two points and the other connects one of those points to a third point, labeling the angle formed by the two segments to illustrate the relationship between polar radius and angle.
The prompt above was compiled from the original drawing commands and is for reference only.