
Graphing Parabolas by Barbara Oropesa
Loading the math board and drawing, please wait…
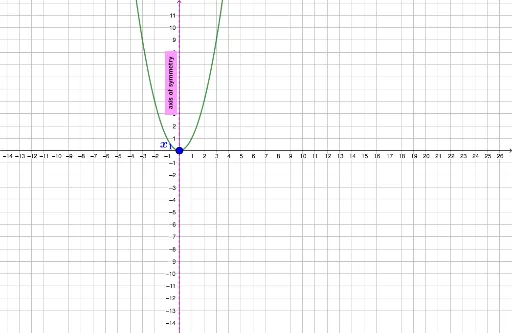
This example demonstrates how to graph parabolas and analyze their key features. It involves core mathematical concepts such as parabola equations, linear programming, properties of triangles, congruence, rational numbers, and hyperbolas. The construction uses GeoGebra commands like Extremum (finding extrema), Intersect (finding intersections), and RotateText (rotating text), with objects including c, b, a, f, B, e, d, A, x_1, x_2, g, text1, text2, text3, D, text8, text4, text5, h, i, text6, j, k, text7, l. It is suitable for high school mathematics teaching or self-study to understand the geometric properties and algebraic representation of parabolas.
GeoGebra Commands & Parameters
Extremum(f) → BIntersect(f, yAxis) → AIntersect(f, xAxis) → x_1, x_2RotateText("axis of symmetry", 90°) → text8