
Graphing Linear Inequalities (Standard Form)
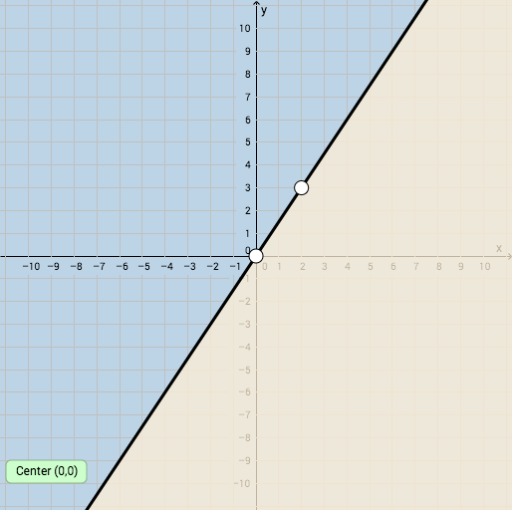
Loading the math board and drawing, please wait…
This example demonstrates how to graph linear inequalities in two variables in standard form. It involves core math concepts like linear inequalities, coordinate geometry, and region representation. Key GeoGebra commands and objects used include Random, Sequence, Union, RandomElement, Line, and Slope to generate random lines and shade inequality regions, making it suitable for high school students learning coordinate geometry or for educational purposes.
GeoGebra Commands & Parameters
Random(-10, 10) → aRandom(-5, 5) → kSequence(i, i, 1, 10, 1) → brightSequence(i, i, -10, -1, 1) → bleftUnion(bleft, bright) → blistRandomElement(blist) → bRandom(1, 4) → nLine(A, B) → jLine(A, B) → lSlope(j) → p
AI Drawing Prompt Reference
Graph linear inequalities in standard form with randomly generated parallel lines and shaded regions, using bright and dark colors to distinguish areas. Start by drawing two lines, then fill the inequality regions based on randomly determined slopes and intercepts to show the solution set representation of linear inequalities.
The prompt above was compiled from the original drawing commands and is for reference only.