
Graphing Linear Equations: y = mx + c
Loading the math board and drawing, please wait…
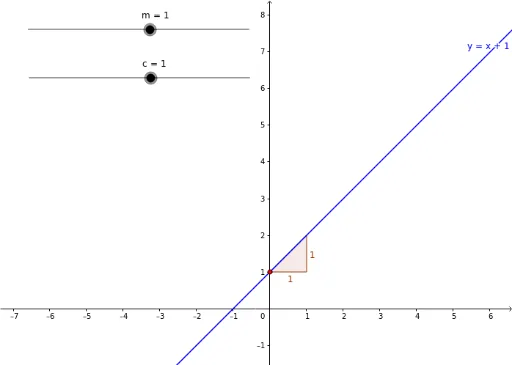
This example demonstrates how to graph the linear equation y = mx + c. Core mathematical concepts include slope (m) and y-intercept (c). Key GeoGebra commands and objects used are Slope, m, c, a, A, m_1. Suitable for middle school and above students learning to plot linear equations and understand parameter variations.
GeoGebra Commands & Parameters
Slope(a) → m_1