
Graphing Linear Equations with Slope Triangles
Loading the math board and drawing, please wait…
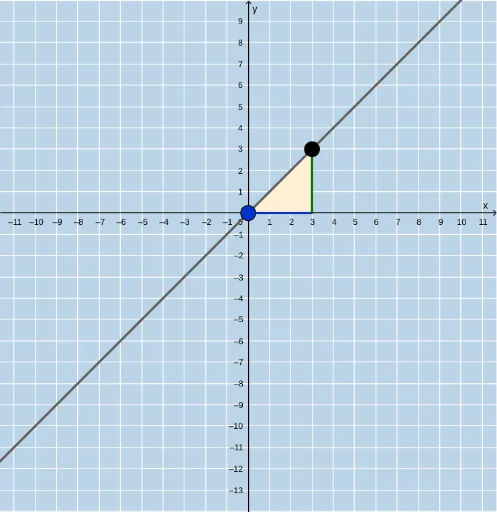
① This example dynamically demonstrates the graph of a linear equation y = mx + b using slope triangles, making the concept of slope visually intuitive. ② Core mathematical concepts include linear equations, slope, intercepts, right triangles, and coordinate geometry involving points, segments, and intersections. ③ Construction highlights: GeoGebra commands such as Sequence, Random, Point, Line, Intersect, Polygon, and Segment are used to create the line, random points, slope triangles, and intersection points; FractionText displays slope as a fraction, while sliders and buttons allow interactive parameter changes, with multiple text objects guiding the steps. ④ Suitable for middle school to high school students learning linear functions and coordinate geometry, as well as for teachers demonstrating the geometric meaning of slope in class.
GeoGebra Commands & Parameters
Sequence(i, i, -10, -1) → aSequence(i, i, -10, -1) → bSequence(i, i, 1, 10) → cUnion(b, c) → dRandom(-12, 12) → ePoint(x = 0) → ALine(A, B) → gFractionText(Slope[f]) → text1FractionText(f(0)) → text2Intersect(j, i) → CPolygon(A, C, B) → poly1, b_1, a_1, c_1Segment(A, C) → kSegment(C, B) → l