
Graphing Linear Equations by Reese Lachner
Loading the math board and drawing, please wait…
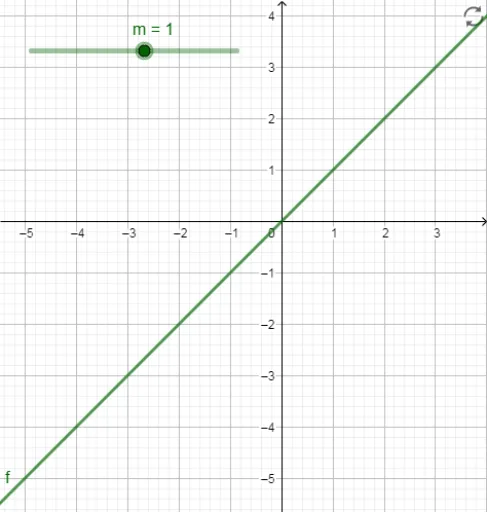
This example demonstrates how to graph linear equations in a coordinate system. The core math concepts involved include linear equations, slope, intercept, and coordinate geometry. The construction highlights the use of GeoGebra objects m (representing slope) and f (representing the function). Suitable for middle school and above students to learn and understand the characteristics of linear function graphs and their parameter variations.
GeoGebra Commands & Parameters
Numeric m(1)y = (m * x)
AI Drawing Prompt Reference
Draw a line with a slope of 1 passing through the origin. First, set the slope m to 1, then plot the line y = 1 * x.
The prompt above was compiled from the original drawing commands and is for reference only.