
Graphing Linear Equations by David Starshaw
Loading the math board and drawing, please wait…
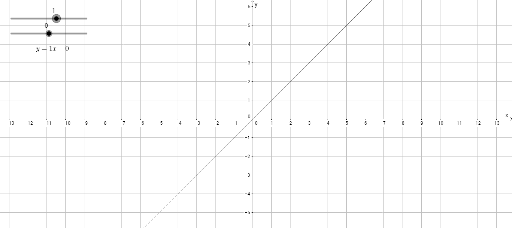
This example demonstrates how to draw linear function graphs from linear equations. Key math concepts include the standard form of linear equations and the geometric properties of straight lines. GeoGebra objects used are a (for slope), b (for y-intercept), text1 (to display equations and graphs), and function f (for defining and plotting the function). Suitable for middle school and above students learning linear functions and analytical geometry, helping to understand the relationship between equations and graphs.
GeoGebra Commands & Parameters
Numeric a(1)Numeric b(0)y = (a * x) + b