
Graphing Linear Equations by Choosing Two Points
Loading the math board and drawing, please wait…
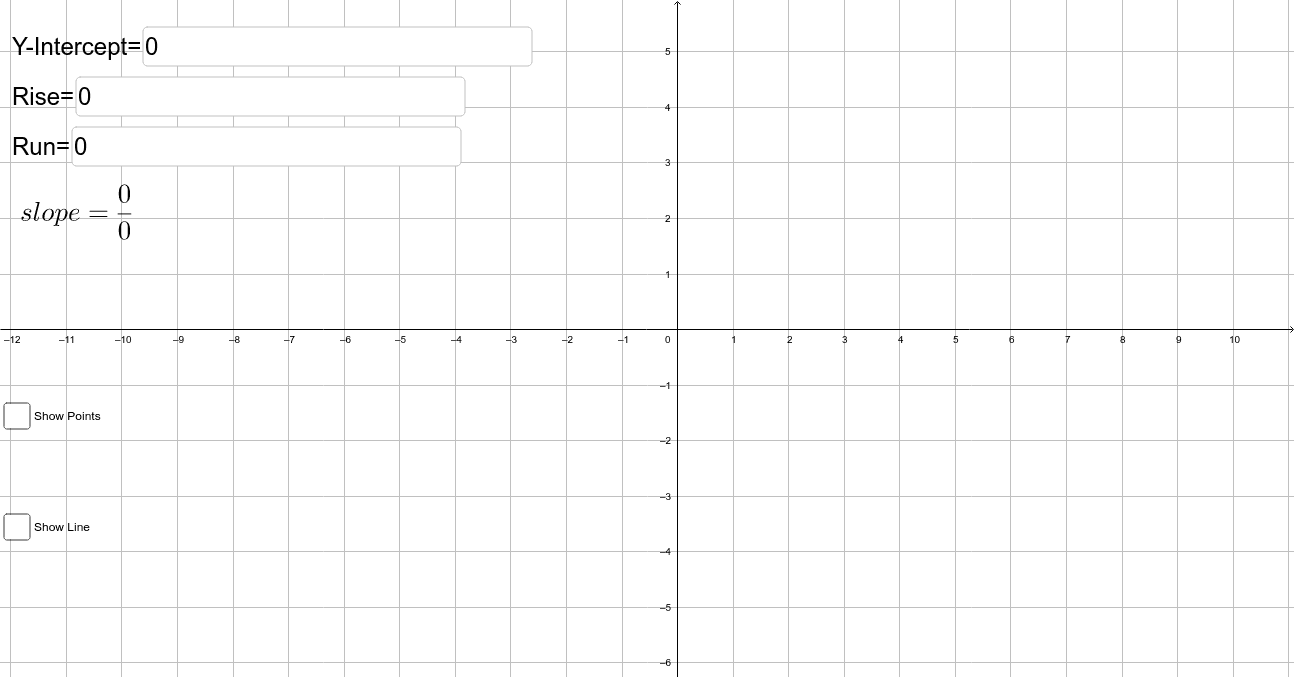
This example demonstrates how to graph a linear equation y=mx+b by selecting two points. Key math concepts include linear equations, slope (rise/run), and y-intercept (b). It uses GeoGebra commands/objects like Textfield, rise, run, b, text1, InputBox1, InputBox2, InputBox3, f, P_1, P_2, a, c for input and plotting. Suitable for middle school and above students learning to graph linear equations.
GeoGebra Commands & Parameters
Textfield(b) → InputBox1Textfield(rise) → InputBox2Textfield(run) → InputBox3