
Graphing Inequalities by cindy.phillips
Loading the math board and drawing, please wait…
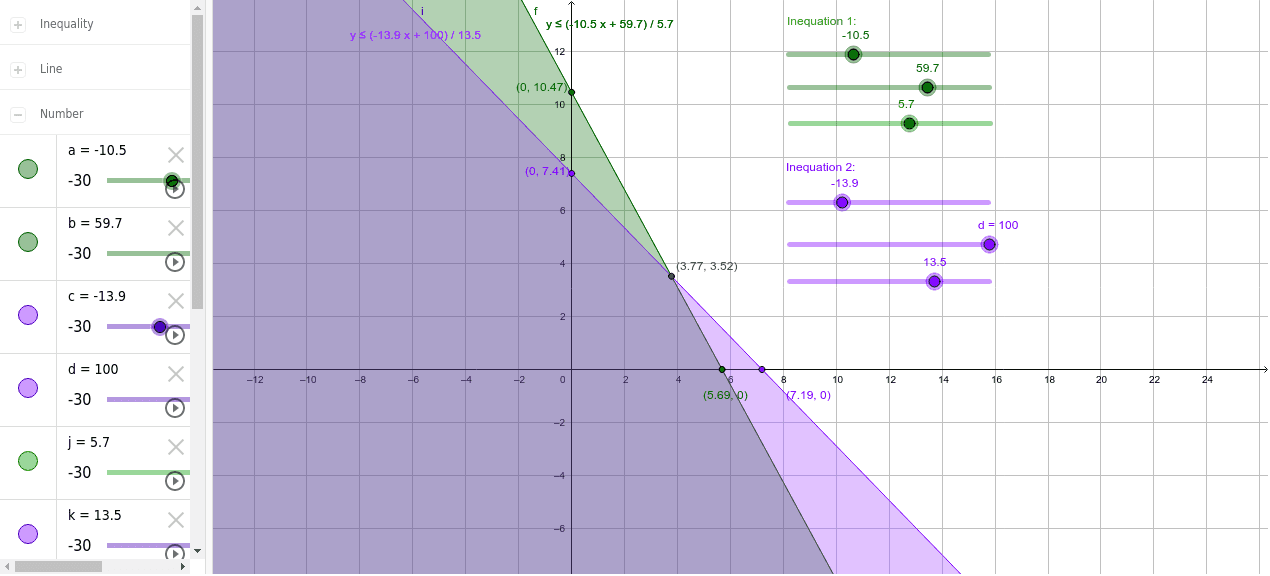
This example demonstrates how to graph inequalities in a coordinate system and observe the solution region. Key math concepts include inequalities, region representation, linear function graphs, boundary lines, and solution set determination. GeoGebra commands and objects used include Intersect and various elements like k, d, c, j, b, a, g, h, text1, text2, f, i, A, B, C, D, E, c_1, l for constructing and displaying inequality graphs and parameters. Suitable for high school mathematics teaching on analytical geometry, helping students understand the geometric meaning and dynamic changes of inequality solution sets.
GeoGebra Commands & Parameters
Intersect(f, i) → AIntersect(i, xAxis) → BIntersect(i, yAxis) → CIntersect(f, yAxis) → DIntersect(f, xAxis) → E
AI Drawing Prompt Reference
Draw the solution set of a linear inequality in a coordinate system by first plotting a line, then finding its intersections with the x-axis and y-axis, and with another line. Use these points to determine the boundary and region of the inequality, and fill the area to represent the solution set.
The prompt above was compiled from the original drawing commands and is for reference only.