
Graphing in Polar Coordinates: Dynamic Parameters and Tangents
Loading the math board and drawing, please wait…
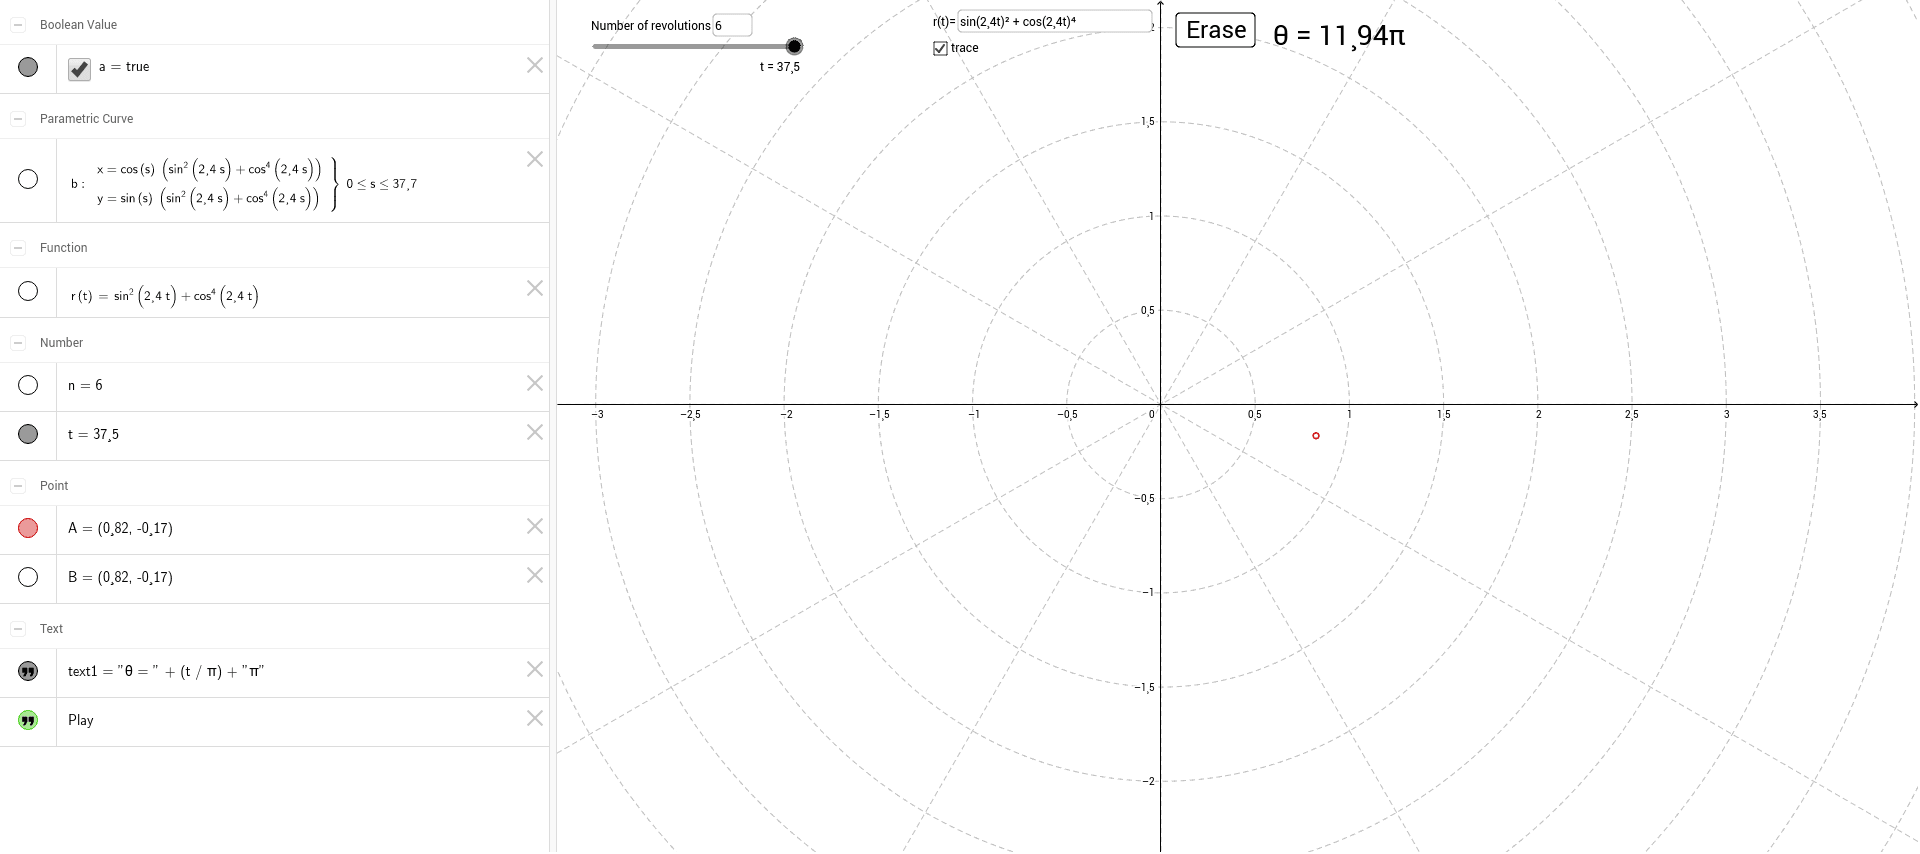
This example demonstrates plotting parametric curves in polar coordinates, with interactive controls to adjust parameters and observe changes in the graph. Core mathematical concepts include polar-to-Cartesian conversion, parametric curves, tangent lines, and vector multiplication. The construction uses GeoGebra's Textfield and button controls, along with the CurveCartesian command to generate curves, while dynamically displaying points, tangents, and incircles. Suitable for high school or early college students to understand polar graphing and parameter effects, and useful for classroom demonstrations.
GeoGebra Commands & Parameters
Textfield(r) → inputBox1Textfield(n) → inputBox2CurveCartesian((cos(s) * r(s)), (sin(s) * r(s)), s, 0, ((2 * n) * π)) → b
AI Drawing Prompt Reference
Create a graph of parametric curves in polar coordinates featuring adjustable parameters and tangents, with sliders to control parameter changes, dynamically displaying points, tangents, and incircles to show the conversion from polar to Cartesian coordinates and the effect of parameters.
The prompt above was compiled from the original drawing commands and is for reference only.