
Graphing Exponential Functions by Thomas Gebbie (4)
Loading the math board and drawing, please wait…
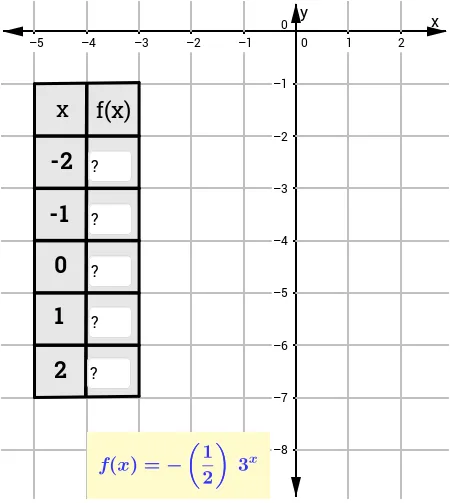
This example demonstrates how to plot points to graph an exponential function. Key math concepts include the properties of exponential functions, their graphical characteristics, and the application of coordinate systems. Construction highlights involve using commands like Segment, Textfield, Polygon, and Point in GeoGebra to mark points, draw shapes, and display text information. Suitable for high school students learning to graph and understand exponential functions.
GeoGebra Commands & Parameters
Segment(F, S) → aSegment(H, T) → bSegment(T, S) → cSegment(H, F) → dSegment(I, J) → eTextfield(l) → inputBox1Textfield(n) → inputBox3Textfield(p) → inputBox5Textfield(q) → inputBox6Textfield(r) → inputBox7Polygon(G, M, N, L) → poly1, g, m_1, n_1, l_1Segment(K, O) → hSegment(P, W) → iSegment(R, F_1) → kSegment(U, G_1) → sSegment(V, H_1) → tSegment(I_1, J_1) → a_1Segment(K_1, L_1) → b_1Point(g) → M_1Segment(N_1, E_1) → d_1Segment(Q, E_1) → j
AI Drawing Prompt Reference
Draw a graph of an exponential function, showing how to plot points to graph the function. Include multiple line segments connecting key points to form closed and open shapes, with text annotations. Start by drawing basic segments to create a framework, then connect points to form polygons, and finally add text boxes to display data.
The prompt above was compiled from the original drawing commands and is for reference only.