
Graphing Compound Inequalities
Loading the math board and drawing, please wait…
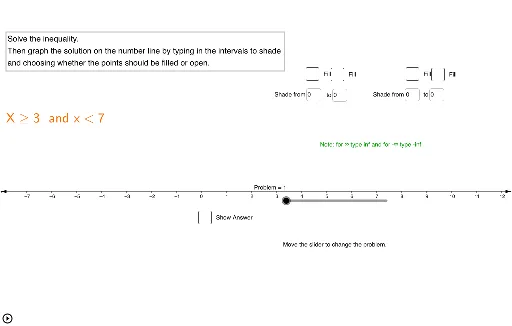
This example demonstrates how to graph the solution set of compound inequalities on a coordinate plane. Key math concepts include inequalities, number line representation, and intervals. Construction highlights involve using GeoGebra commands/objects like Textfield, objects s, l, j, i, h, f, a, b, c, d, e, n, m, o, inputBox5, inputBox6, p, q, n_1, r, text1, text2, B, A, k, Problem, text12, text15, text11, text13, text16, inputBox1, inputBox2, t, u, v, D, C, text14, text17 for input, calculation, and visualization. Suitable for high school students learning the graphical representation of inequality solution sets.
GeoGebra Commands & Parameters
Textfield(m) → inputBox5Textfield(o) → inputBox6Textfield(c) → inputBox1Textfield(e) → inputBox2