
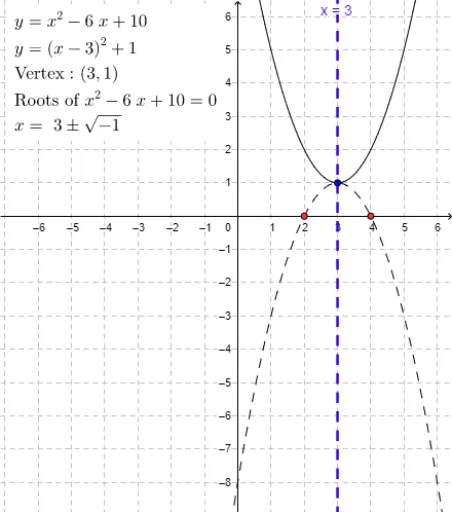
Graphing Complex Roots of Quadratic Equations
Loading the math board and drawing, please wait…
In collections
AMSP PD Videos - Teaching Further Pure
This example demonstrates plotting the complex roots of quadratic equations on the complex plane. Key math concepts include complex numbers, discriminants of quadratic equations, and the complex coordinate system. GeoGebra commands used are Intersect, OrthogonalLine, and ComplexRoot, with objects like A, p, q, f, s, t, g, h, B, C, D, E, a_1, text6, text7, text8, z_3, z_4, u, c, text9, text1, text2, a. Suitable for high school mathematics education to understand the geometric meaning of complex roots and properties of quadratic equations.
GeoGebra Commands & Parameters
Intersect(f, xAxis) → B, CIntersect(h, xAxis) → D, EOrthogonalLine(A, xAxis) → a_1ComplexRoot(f) → z_3, z_4