
Graphically Solving Equations and Inequalities
Loading the math board and drawing, please wait…
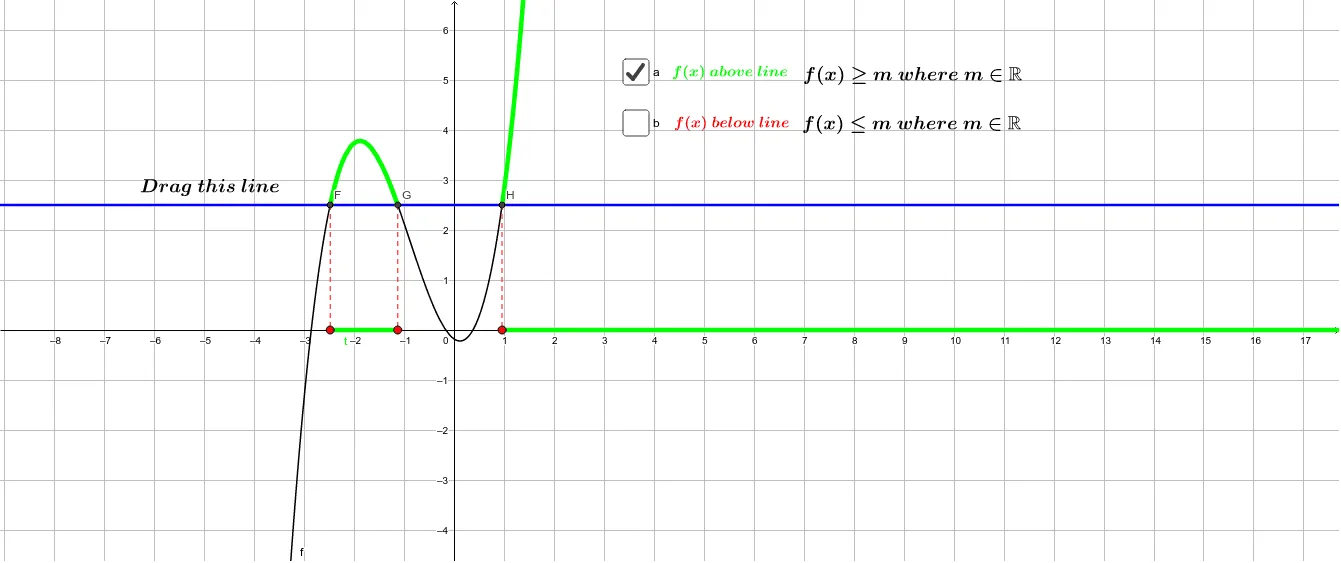
This example demonstrates solving equations and inequalities graphically by plotting functions and identifying intersections, extrema, and solution sets. Core math concepts include functions, equations, inequalities, roots, and optimization. GeoGebra commands like Extremum, Root, Intersect, Segment, and Point are used with objects such as f, g, A, B. Ideal for high school mathematics education to visualize the relationship between function graphs and solutions.
GeoGebra Commands & Parameters
Extremum(f) → A, BRoot(f) → C, D, EIntersect(f, g) → F, G, HSegment(G, J) → iSegment(H, K) → jSegment(F, I) → kPoint(g) → L