
Graphically Finding Eigenvalues of Matrix [[1,2];[2,1]]
Loading the math board and drawing, please wait…
In collections
UNSW MATH1131/1231 Algebra material
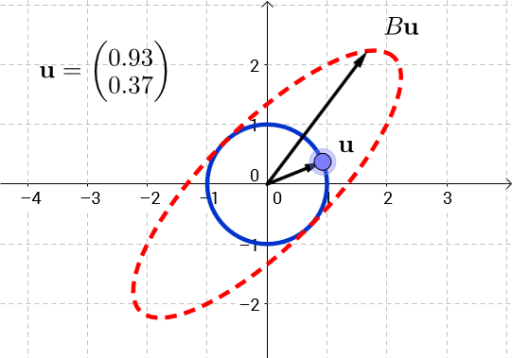
This example demonstrates how to graphically find the eigenvalues of the matrix [[1,2];[2,1]] by visualizing the transformation and observing invariance of eigenvectors. Key math concepts include eigenvalues, eigenvectors, linear transformations, and matrix operations. GeoGebra commands used are Intersect, Point, and Vector to construct the transformation graph. Suitable for high school and above learners to visualize abstract linear algebra concepts.
GeoGebra Commands & Parameters
Intersect(xAxis, yAxis) → APoint(c) → BVector(A, B) → uVector((x(u) + (2 * y(u)), (2 * x(u)) + y(u))) → v