
Graphical Solution of Absolute Value Inequality |ax-b| > c
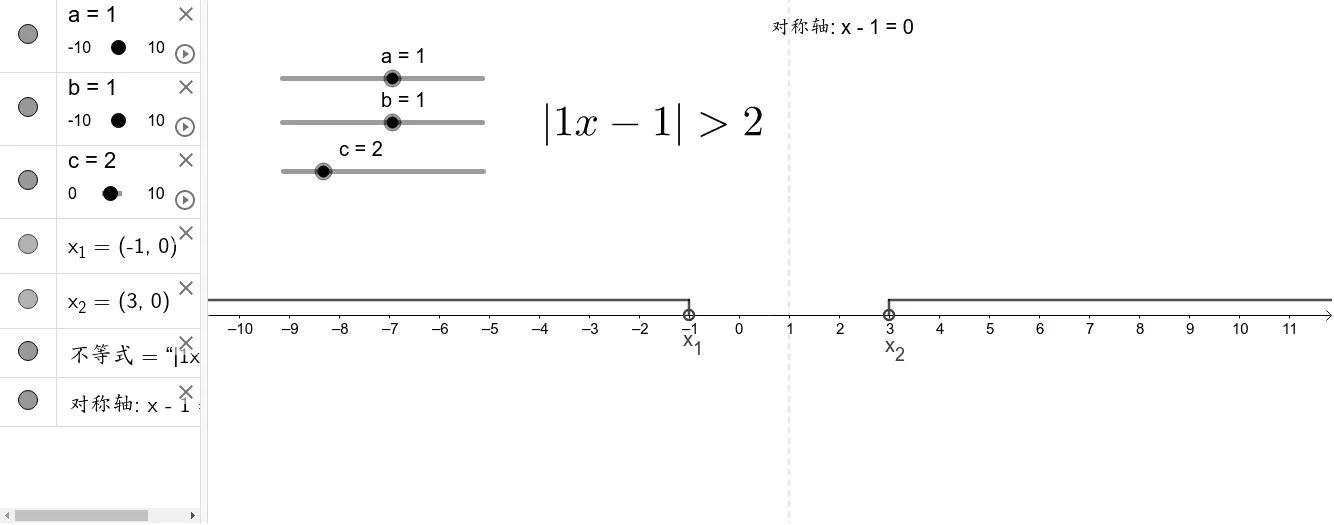
This GeoGebra applet dynamically demonstrates the solution process for the absolute value inequality |ax - b| > c. Users can adjust the parameters a, b, and c via interactive sliders to observe real-time changes in the function graph and the corresponding solution intervals on the number line. The construction includes the axis of symmetry, relevant line segments, and key points x₁ and x₂, visually illustrating the symmetry property of the absolute value function f(x) = |ax - b| about its axis of symmetry. The V-shaped graph clearly reveals how the inequality |ax - b| > c corresponds to the portions of the graph that lie above the horizontal line y = c, and how the solution set on the number line is represented by the union of two disjoint intervals. This applet is designed for high school algebra instruction on absolute value inequalities, helping students understand how parameter changes affect the solution set and master both the algebraic and geometric interpretations of inequalities of the form |ax - b| > c.
In collections
Vocational High School Mathematics
Loading the math board and drawing, please wait…