
Graphical Representation of Inequalities
Loading the math board and drawing, please wait…
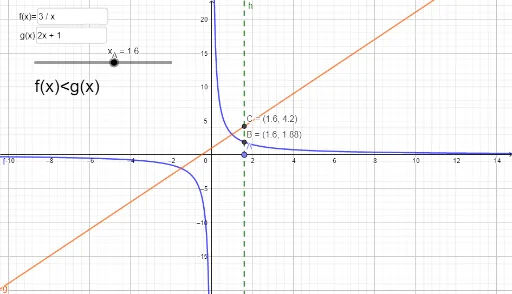
This example demonstrates how to graphically represent inequalities. Key mathematical concepts include inequalities, transformations, and functions. Using GeoGebra commands such as Textfield, OrthogonalLine, Intersect, and If, the graphical representation of inequalities is constructed. Suitable for high school mathematics education and learning.
GeoGebra Commands & Parameters
Textfield(f) → InputBox1Textfield(g) → InputBox2OrthogonalLine(A, xAxis) → hIntersect(f, h, (1.6, 1.875)) → BIntersect(g, h) → CIf(y(B) > y(C), "f(x)>g(x)", y(B) ≟ y(C), "f(x)=g(x)", y(B) < y(C), "f(x)<g(x)", "N.A.") → text2
AI Drawing Prompt Reference
Graph the representation of inequalities. First, input two function expressions, then plot their graphs. Next, draw a perpendicular line to the graph of the first function and find its intersection with the graph of the second function. Then, draw the intersection of the perpendicular line with the first function and determine the y-coordinate of the intersection point. Finally, based on the y-coordinate relationship, display the inequality f(x)>g(x), f(x)=g(x), or f(x)<g(x).
The prompt above was compiled from the original drawing commands and is for reference only.