
Graphical Demo for Limits of Product and Composition
Loading the math board and drawing, please wait…
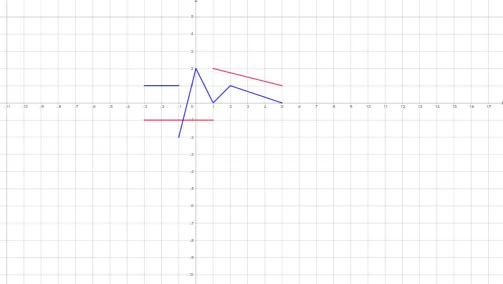
This example demonstrates the graphical approach to understanding limits of product and composition of functions in calculus. It involves core math concepts like limits, function products, composite functions, and coordinate geometry. The construction uses GeoGebra objects f, g, k, h to visualize the limit processes. Suitable for high school and above students for learning and teaching calculus and function graphics.
GeoGebra Commands & Parameters
f(x) = If[-3 ≤ x ∧ x < 1, (-x^(0)), If[x ≥ 1 ∧ x ≤ 1, x^(0), If[1 < x ∧ x ≤ 5, 2 - (1 / 4 * (x - 1))]]]g(x) = If[-3 ≤ x ∧ x < -1, 1, If[-1 ≤ x ∧ x ≤ 0, 2 + (4 * x), If[0 < x ∧ x ≤ 1, 2 - (2 * x), If[1 < x ∧ x < 2, x - 1, If[x ≤ 2 ∧ x ≥ 2, -1, If[2 < x ∧ x ≤ 5, 1 - (1 / 3 * (x - 2))]]]]]]k(x) = f(g(x))h(x) = (f(x) * g(x))