
Graphical Data Representation Practice
Loading the math board and drawing, please wait…
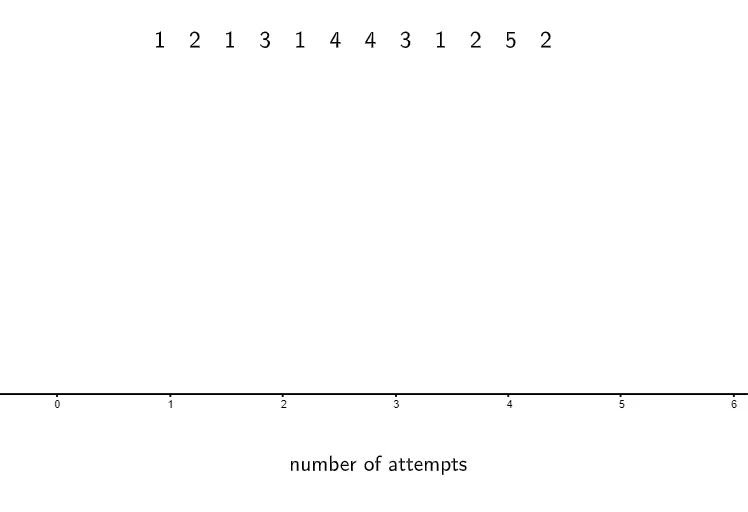
This example demonstrates how to use GeoGebra to visually represent data. Core math concepts include data visualization, chart drawing, and geometric properties. Key GeoGebra commands used are TableText with objects text3 and text1 to display data. Suitable for elementary and above students for data visualization and geometry learning.
GeoGebra Commands & Parameters
TableText({1, 2, 1, 3, 1, 4, 4, 3, 1, 2, 5, 2}) → text1
AI Drawing Prompt Reference
Draw a data chart with 12 points at coordinates (1,1), (2,2), (1,3), (1,4), (4,3), (1,1), (2,5), (2,2), and connect these points with line segments to form a geometric shape.
The prompt above was compiled from the original drawing commands and is for reference only.