
Graph the Line by garciae
Loading the math board and drawing, please wait…
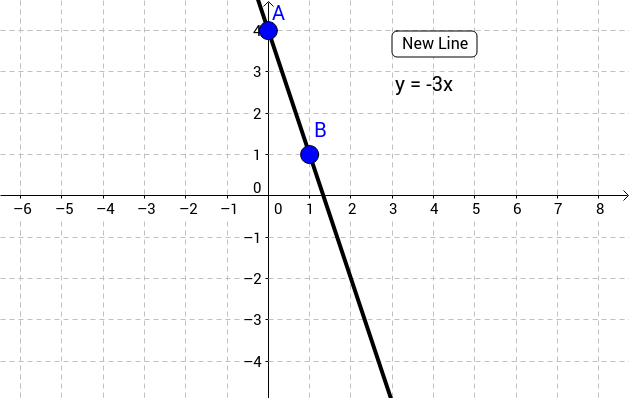
This example demonstrates how to graph a line in a coordinate system by dragging points A and B. Core math concepts include coordinate geometry and line equations. Construction highlights: the Line command is used to draw the line, button1 and text1 for interaction and prompts, points A and B as draggable elements, and text2 for displaying information. Suitable for middle school and above students learning line equations and coordinate systems, or for mathematical teaching demonstrations.
GeoGebra Commands & Parameters
Line(A, B) → b
AI Drawing Prompt Reference
Draw a line in a coordinate system that passes through two draggable points, and display the equation of the line. The two points can be moved by dragging, and the line will update in real-time as the points move. Include interactive elements like buttons and text on the interface to prompt and display the coordinates of the points and the equation of the line, helping to understand coordinate geometry and line equations.
The prompt above was compiled from the original drawing commands and is for reference only.