
Graph Quadratic Functions Using a Table of Values
Loading the math board and drawing, please wait…
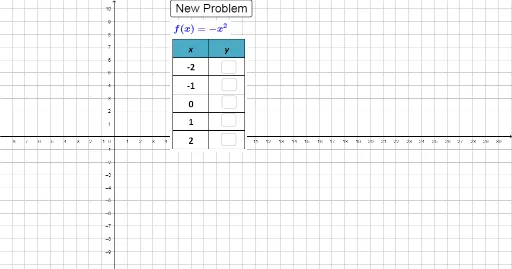
This example demonstrates how to graph a quadratic function y=ax²+bx+c by generating a table of values. It shows the process of inputting x-values, computing corresponding y-values, and plotting the points to form the parabola. Core mathematical concepts include the standard form of a quadratic function, the axis of symmetry, the vertex, and the construction of a value table. The construction uses GeoGebra commands such as Textfield and inputBox to create interactive input fields for coefficients a, b, and c, a button (button1) to trigger calculations, a list (list1) to store points, and multiple point objects (A1-A6, B1-B6) to plot the graph. This resource is suitable for middle and high school students learning quadratic functions, as well as for teachers demonstrating how coefficient changes affect the parabola's shape.
GeoGebra Commands & Parameters
Textfield(c_1) → inputBox1Textfield(d_1) → inputBox2Textfield(e_1) → inputBox3Textfield(g_1) → inputBox4Textfield(h_1) → inputBox5
AI Drawing Prompt Reference
Draw a graph of a quadratic function y=ax²+bx+c using a table of values. In a coordinate plane, create five input fields for coefficients a, b, c, and two parameters for x-value range. Based on the entered x-values, compute corresponding y-values and plot multiple points (e.g., six points) on both sides of the parabola. Connect these points with a smooth curve to form the parabola. Also indicate the axis of symmetry and the vertex. The graph should clearly show how changes in coefficients affect the parabola's direction, width, and position.
The prompt above was compiled from the original drawing commands and is for reference only.